Disclaimer: The opinions expressed by our writers are their own and do not represent the views of U.Today. The financial and market information provided on U.Today is intended for informational purposes only. U.Today is not liable for any financial losses incurred while trading cryptocurrencies. Conduct your own research by contacting financial experts before making any investment decisions. We believe that all content is accurate as of the date of publication, but certain offers mentioned may no longer be available.
Sunday is about to finish out the week with domination from the bears Out of the Top 10 coins, only Binance Coin (BNB) is in the green. The rate of the trading platform's native exchange token has gone up by 1.01% since yesterday.
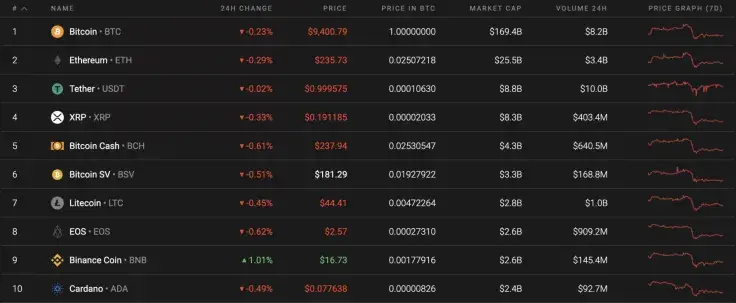
Below is the crucial information for Bitcoin (BTC), Ethereum (ETH), and XRP:
|
Name |
Ticker Advertisement
|
Market Cap |
Price |
Volume (24H) Advertisement
|
Change (24H) |
|
Bitcoin |
BTC |
$173,370,927,155 |
$9,420.09 |
$16,607,728,719 |
-0.41% |
|
Ethereum |
ETH |
$26,293,634,654 |
$236.14 |
$7,111,597,176 |
-0.42% |
|
XRP |
XRP |
$8,479,432,414 |
$0.192221 |
$987,545,866 |
-0.49% |
BTC/USD
Bitcoin (BTC) is still showing signs of growth; however, it is not as strong as it was when it retested the $10,400 mark a few weeks ago. Since last week, the decline has constituted a drop of 1.60%.
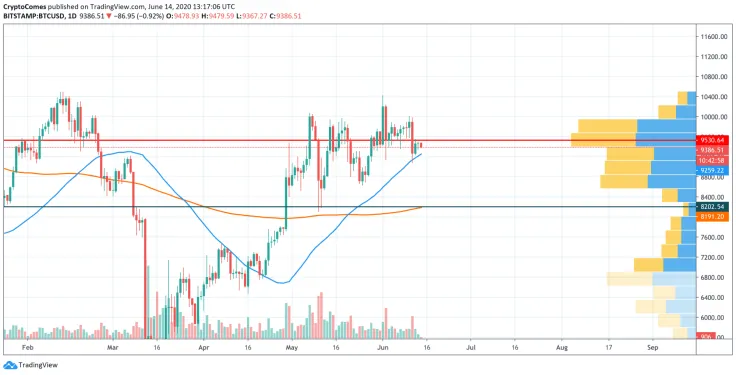
Looking at the daily time frame, the leading crypto touched the 50-Day Moving Average (MA 50), which was then followed by a fast bounce off to $9,500. However, the bears continue pushing Bitcoin (BTC) back towards the $9,000 zone. What is more, the price decrease is supported by a falling trading volume. If the MA 50 is broken, then the first crypto move might be towards the $8,200 support zone, which corresponds to the 200-Day Moving Average (MA 200).
At press time, Bitcoin was trading at $9,389.
ETH/USD
Ethereum (ETH) has an almost identical trading pattern to Bitcoin (BTC). The decline since yesterday is around 0.14%, just as the top crypto.
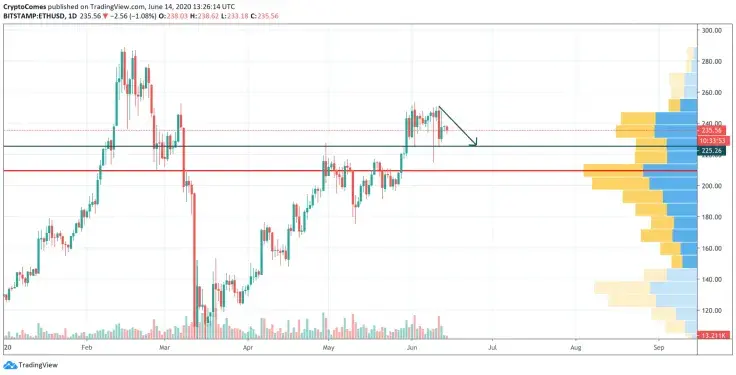
The chief altcoin is about to finish its long-term bullish trend that started in March 2020. Even though the trading volume is not going down as fast, the liquidity level suggests that there are no interested buyers. Moreover, long bearish candles have appeared, which are signals of a powerful sell at the $250 level. Respectively, Ethereum (ETH) might retest the $225 support mark before growth continues. In case bears break this level, the long-term outlook will be cancelled.
At press time, Ethereum was trading at $234.99.
XRP/USD
XRP is the biggest loser from our list. The coin has lost significantly more than Bitcoin (BTC) and Ethereum (ETH) since yesterday, with a decline of 4.81% since last week.
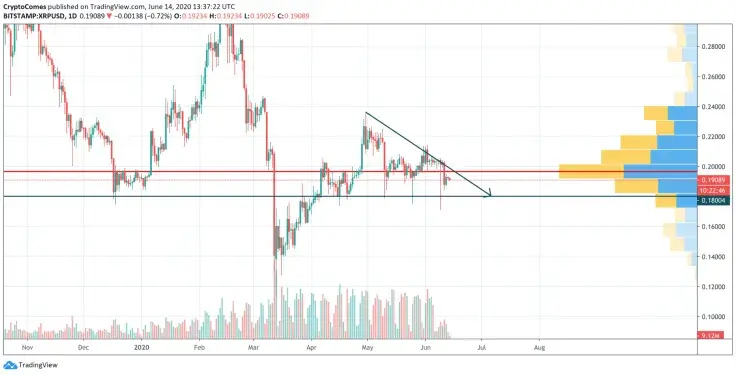
XRP has been falling since April 30th, which was when the crypto made a false breakout at the $0.3250 level. Since then, the trading volume has continued to decline sharply as well as the rate of XRP. In this particular case, there is a high probability of seeing the coin at the $0.18 support next week, which is where a high concentration of liquidity is focused.
At press time, XRP was trading at $0.1908.
 Dan Burgin
 U.Today Editorial Team