
Disclaimer: The opinions expressed by our writers are their own and do not represent the views of U.Today. The financial and market information provided on U.Today is intended for informational purposes only. U.Today is not liable for any financial losses incurred while trading cryptocurrencies. Conduct your own research by contacting financial experts before making any investment decisions. We believe that all content is accurate as of the date of publication, but certain offers mentioned may no longer be available.
Solana keeps on making new headlines, brushing up against the crucial $30 price mark. This is not just a random figure; the $30 point serves as an important psychological resistance level for SOL due to the previous price action.
It is worth noting that this is not the first time Solana has interacted with this price level. Looking back to July, SOL witnessed a reversal around this exact benchmark, making the current movement even more intriguing for market watchers.
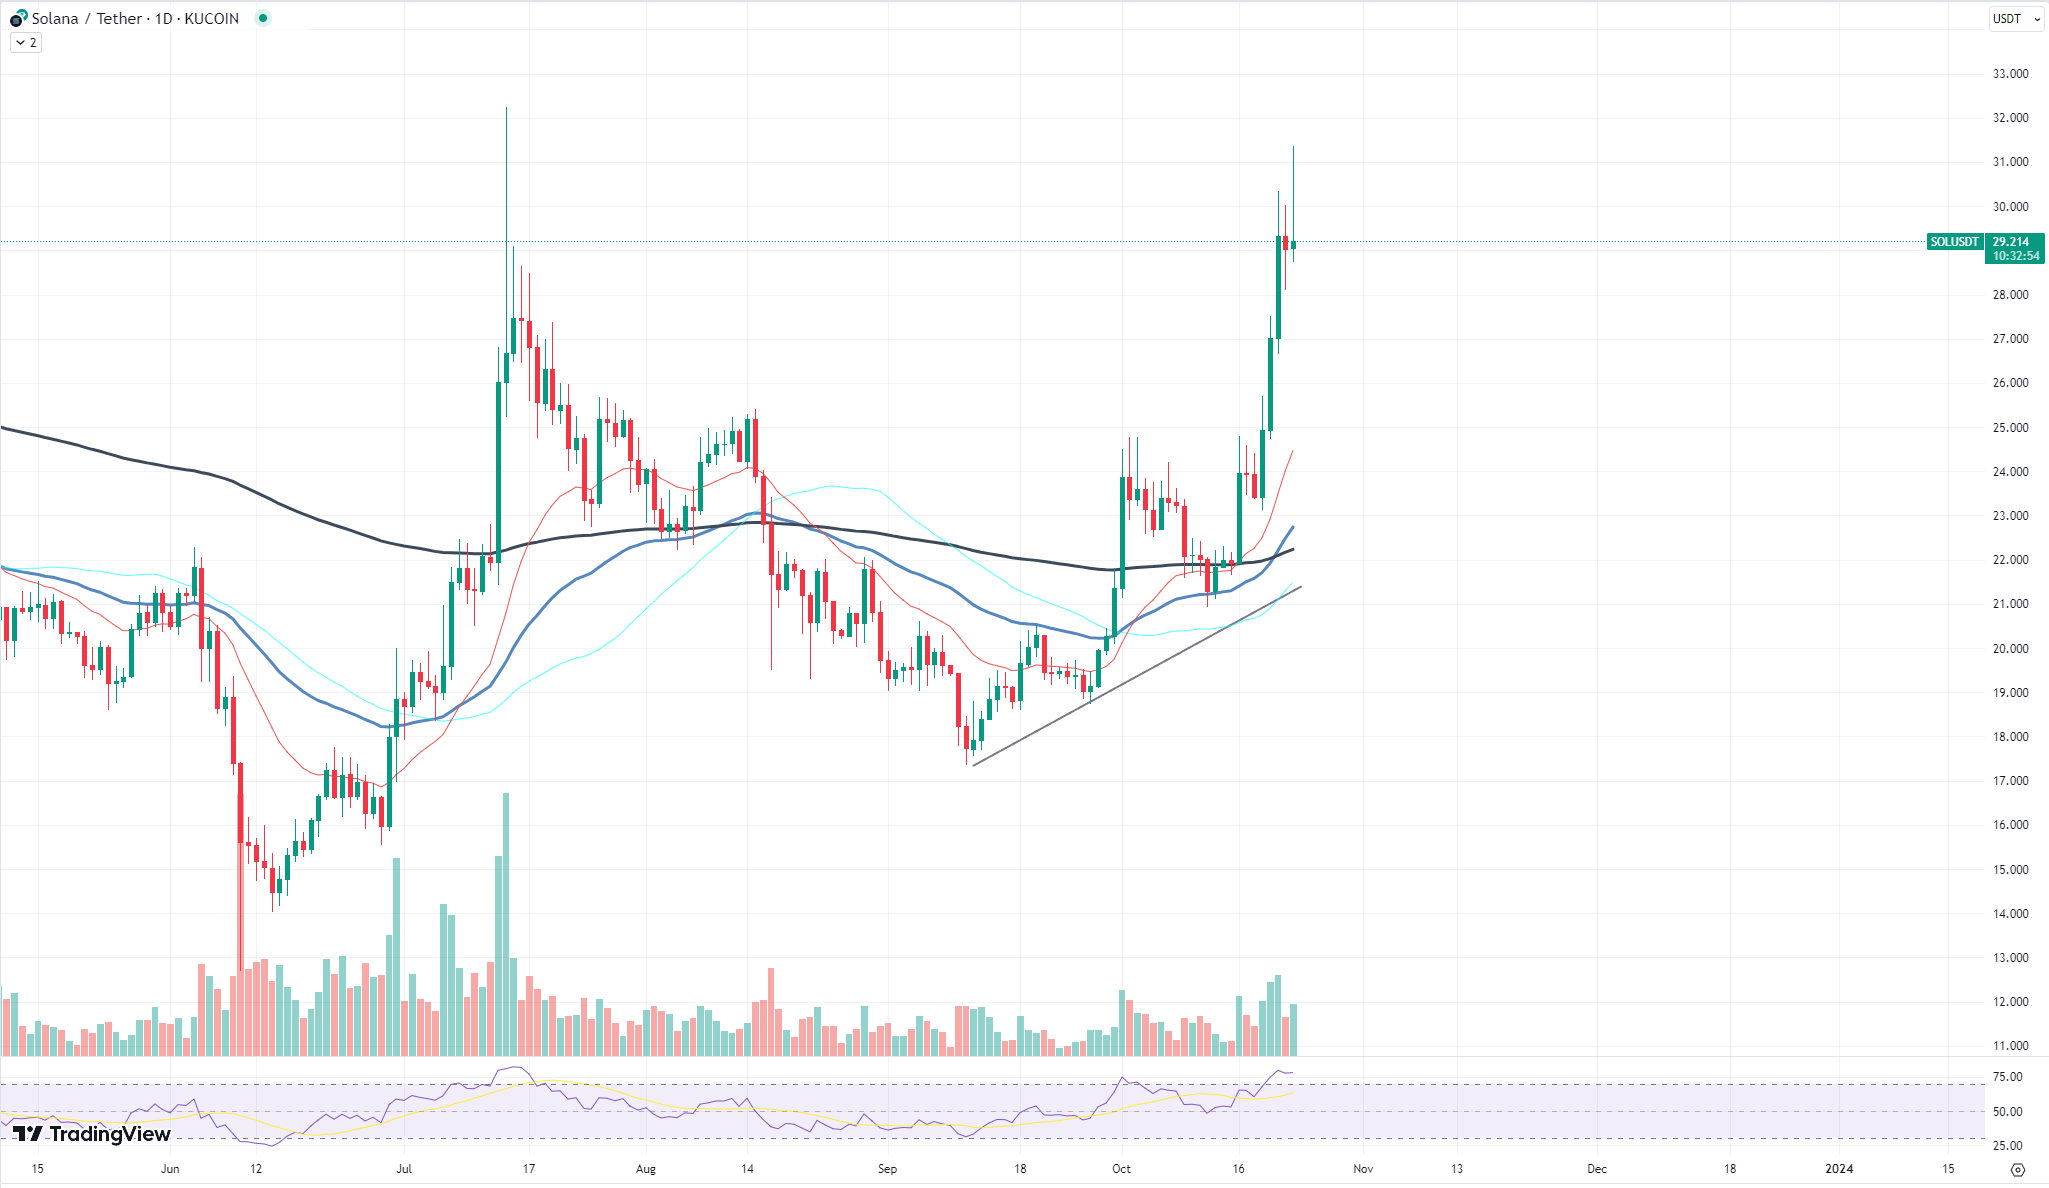
One of the most exciting technical patterns emerging from the SOL price chart is the "golden cross." This pattern occurs when a short-term moving average, typically the 50-day moving average, crosses above a long-term moving average, often the 200-day.
Adding to this bullish narrative is the surging Relative Strength Index (RSI). For those unfamiliar, the RSI is a momentum indicator that measures the speed and change of price movements. An RSI above 70 is generally considered overbought, while one below 30 is deemed oversold. Currently, SOL's RSI is on the rise, pointing to strong buying pressure and reinforcing the bullish stance on the asset.

While the resistance level of $30 is pivotal, investors should also be keenly aware of two other significant price levels. First, the $25 mark, which in the past has acted as both support and resistance, could provide a cushion should SOL experience any short-term pullbacks. Second, the $35 threshold, if breached, could open doors to new highs and further validate Solana's ongoing bullish trajectory.
Cardano ready to move
Cardano (ADA), known for its third-generation blockchain technology, has recently caught the attention of traders and investors worldwide. One reason for the intensified gaze is the critical resistance point visible on its daily chart. This resistance, which ADA is currently flirting with, holds paramount significance.
A close analysis of the chart reveals that this resistance level has not been breached even once in the recent past. Every attempt made by ADA's price to rally above this resistance met with a decline. Now, as ADA's price is again surging toward this pivotal mark, the entire crypto community is left wondering: Is this the moment Cardano finally breaks through?

The significance of ADA breaking this resistance cannot be overstated. If it manages to comfortably situate itself above this line, it can solidify around a new support level, allowing ADA to aim for even loftier targets. On the flip side, if ADA fails to pierce through and faces a pullback, it may have to grapple with the possibility of retesting lower support zones.
Polygon shows bullish dynamic
Polygon's price dynamics have been the talk of the market recently, especially with its breakthrough above the 50-day Exponential Moving Average (EMA) that we witnessed a few days ago. This move paints a potentially bullish picture, indicating a strong momentum build-up, pushing MATIC toward its next pivotal resistance: the 200-day EMA.
Diving deeper into the technicals, MATIC's volume profile offers insights that cannot be ignored. A consistent increase in trading volume accompanying its price surge suggests genuine buying interest rather than a mere speculative pump. High trading volumes in bullish rallies serve as a testament to the conviction of market participants.
Equally intriguing is the Relative Strength Index (RSI) trajectory. Hovering above the neutral zone and not yet in overbought territory, MATIC's RSI indicates room for further upward movement. This momentum, when combined with the recent 50 EMA breakthrough, strengthens the case for a test of the 200 EMA in the near term.
 Dan Burgin
 U.Today Editorial Team