
Disclaimer: The opinions expressed by our writers are their own and do not represent the views of U.Today. The financial and market information provided on U.Today is intended for informational purposes only. U.Today is not liable for any financial losses incurred while trading cryptocurrencies. Conduct your own research by contacting financial experts before making any investment decisions. We believe that all content is accurate as of the date of publication, but certain offers mentioned may no longer be available.
Shiba Inu saw a minor price increase, which raises recovery expectations, but a closer look at the chart shows there is not much of a foundation for a full-blown bullish retrace. SHIB's longer-term future does not look as bright as one would like to see.
The price of SHIB is currently around $0.00001352, which indicates a slight increase from its most recent lows. The truth is different from what might seem to be a recovery. The asset is still well below its downward trendline, which has served as resistance for a long time. Gains in the short term should be regarded cautiously until SHIB breaks above this crucial level.
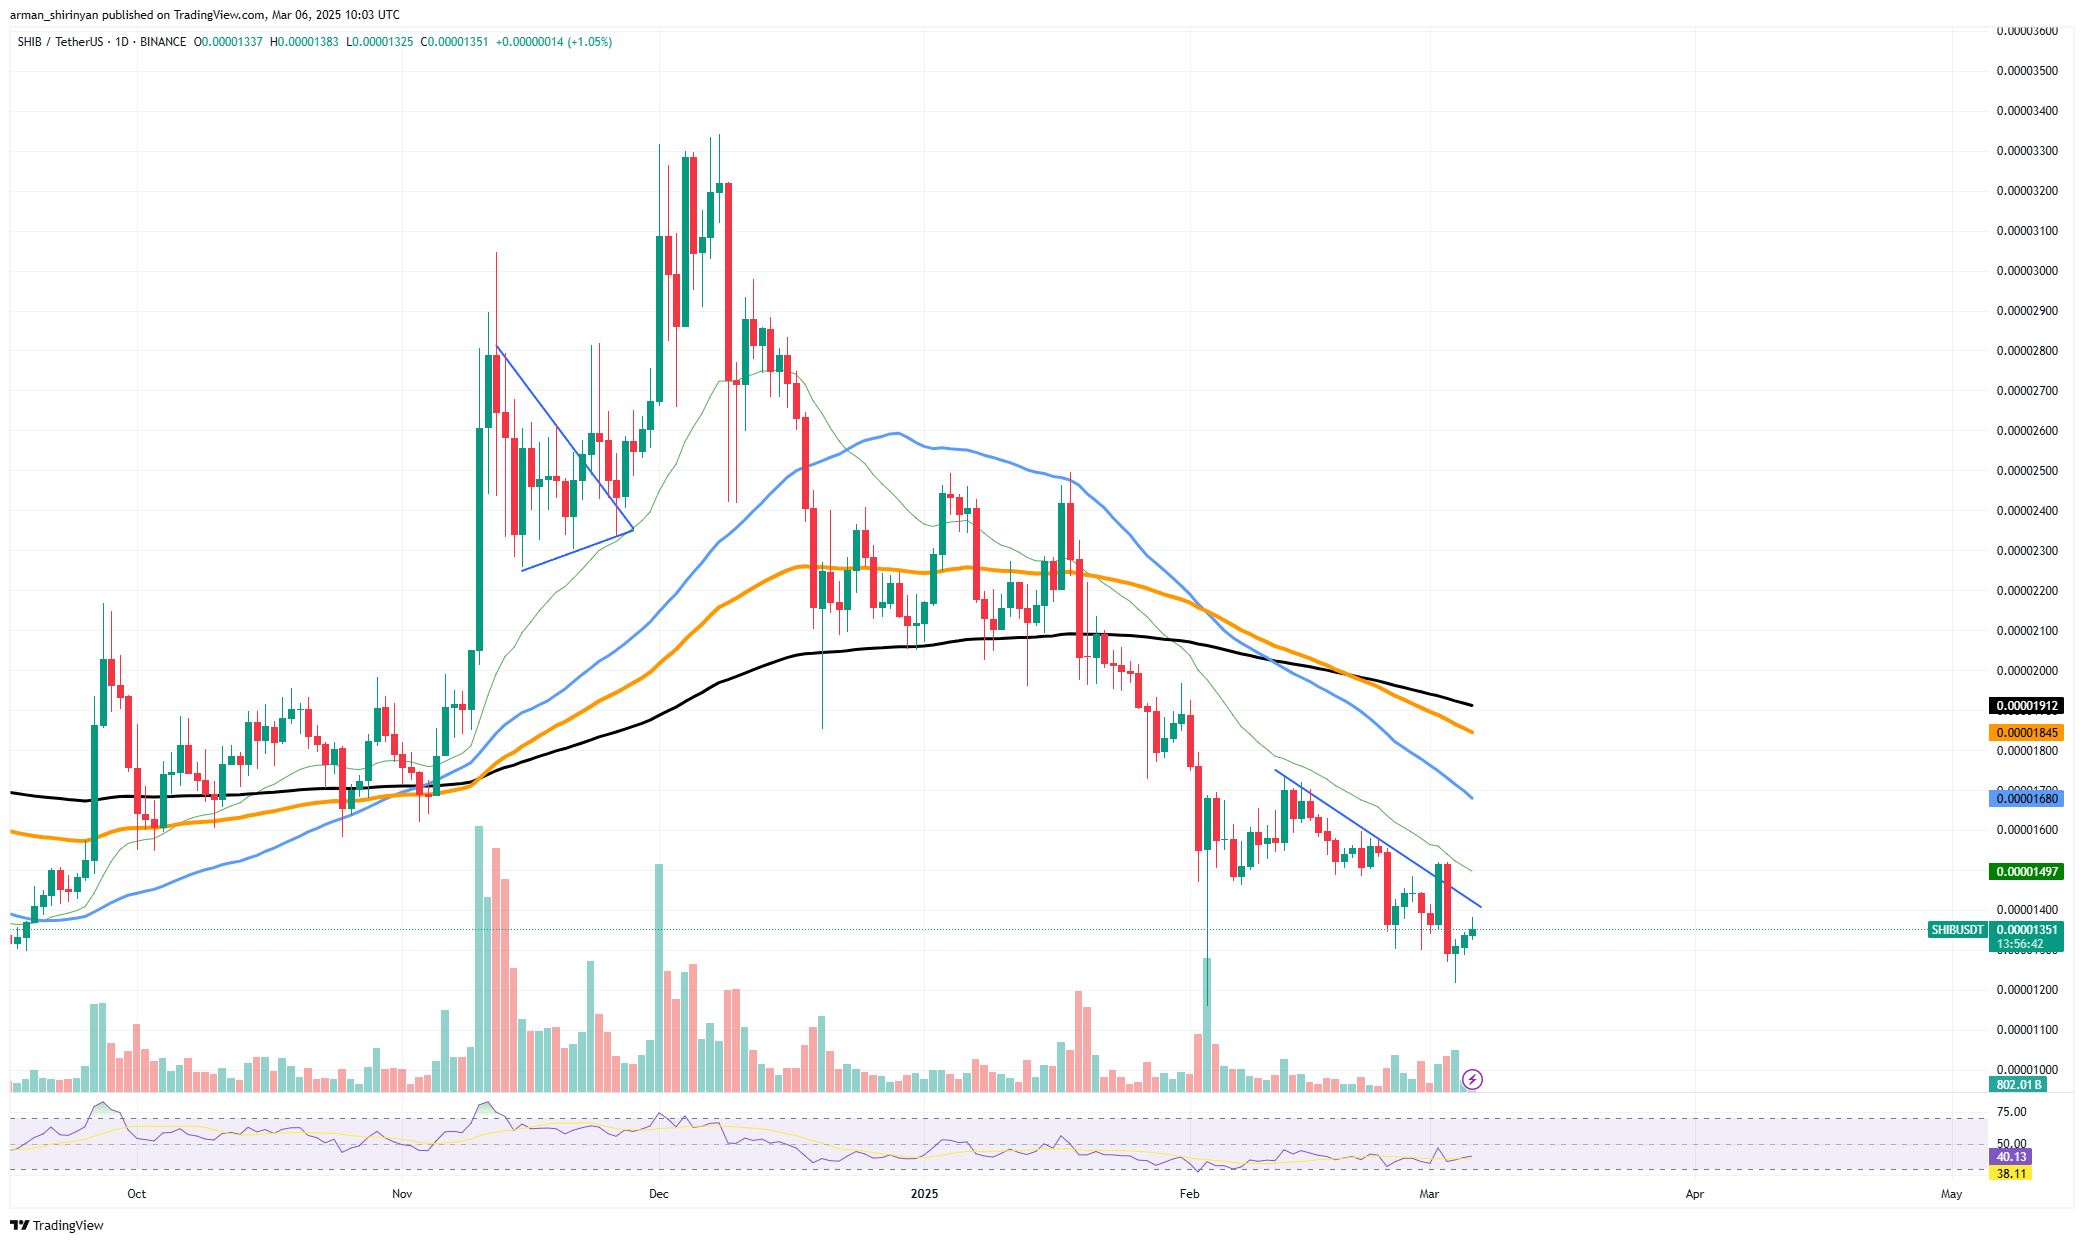
The overall trend is still bearish, with lower highs and lower lows creating a traditional downward pattern. Just a retracement, the most recent price movement was probably caused by short-term traders profiting from oversold conditions. SHIB needs to surpass the indicated trendline, which is presently located close to $0.00001497 in order to make a real recovery. A robust breakout above this mark backed by a sizable volume would suggest that bullish momentum is starting to return.

Without this, SHIB is still susceptible to additional drops. Another leg down is probably in store if SHIB is unable to break above its key resistance level. A break below $0.00001200, the next significant support level, might lead to a further decline. Conversely, if SHIB is able to rise above $0.00001500, it may test higher resistance levels close to $0.00001680 and beyond.

Even though SHIB has recently recovered, it is not in recovery mode. The asset is still stuck in a downward trend; a possible change in momentum would only be indicated by a break above the trendline resistance. Any upward movement until then should not be seen as the start of a new bullish phase but rather as a brief correction.
 Dan Burgin
 U.Today Editorial Team