
Disclaimer: The opinions expressed by our writers are their own and do not represent the views of U.Today. The financial and market information provided on U.Today is intended for informational purposes only. U.Today is not liable for any financial losses incurred while trading cryptocurrencies. Conduct your own research by contacting financial experts before making any investment decisions. We believe that all content is accurate as of the date of publication, but certain offers mentioned may no longer be available.
According to the most recent data provided by Santiment, "memecoins" like SHIB, DOGE and ELON are moving with a reverse correlation with the so-called "Social Dominance" indicator. Once the indicator reaches new lows, the price of the aforementioned coin rapidly rises.
Memecoins on the rise
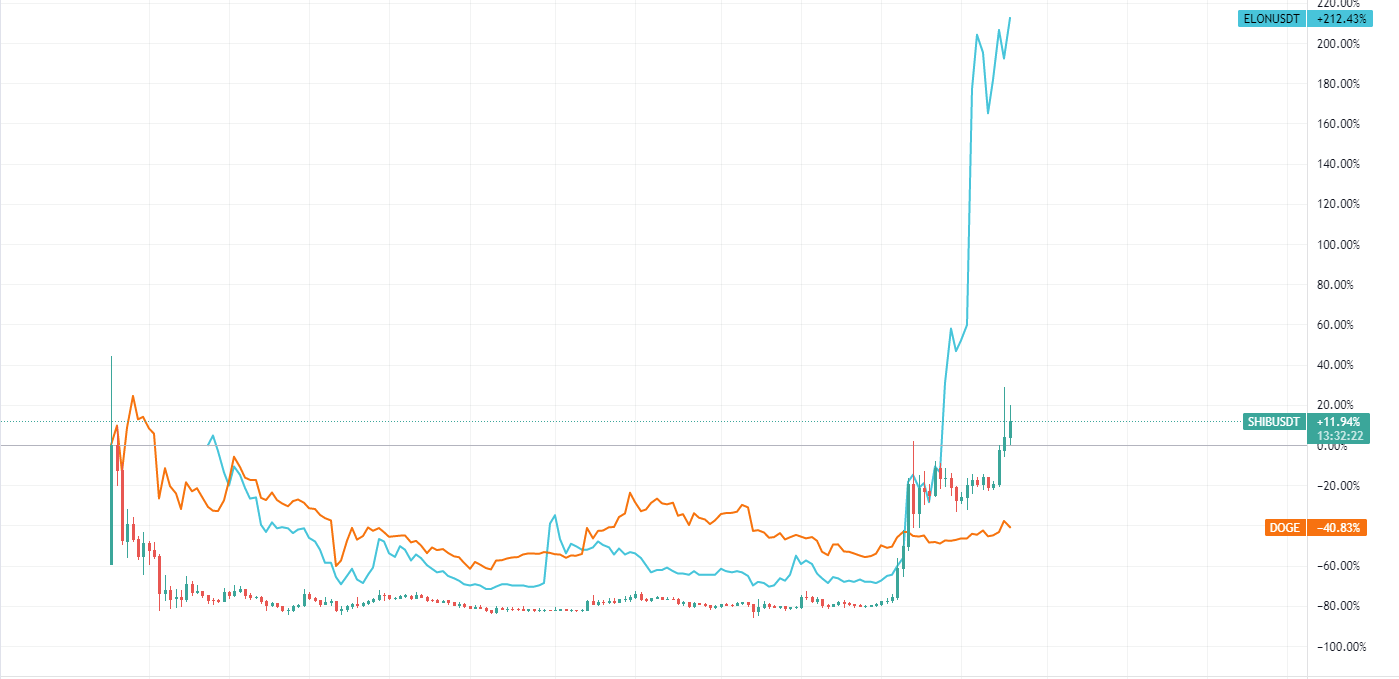
Overall, meme-based and community-driven coins have been the trend in recent months with Shiba Inu showing a 490% price increase, Doge being up by 28% percent in the last month, and Elon Musk showing a ridiculous 889% price increase in the last month only. One way or another, the community is the main fuel for those coins rather than institutional investors or use cases.
While trading pairs for such coins remain extremely volatile, there is no proper way to analyze them by using financial or technical analysis, which leaves traders with on-chain and market metrics like the ones presented by Santiment.
Reverse correlation
On the chart provided by the service, users can see the price of each mentioned coin and the Social Dominance indicator. Once communities "forget" about the coins and the indicator starts moving downwards, their price rapidly goes down and retraces back up only when whales are buying them back.
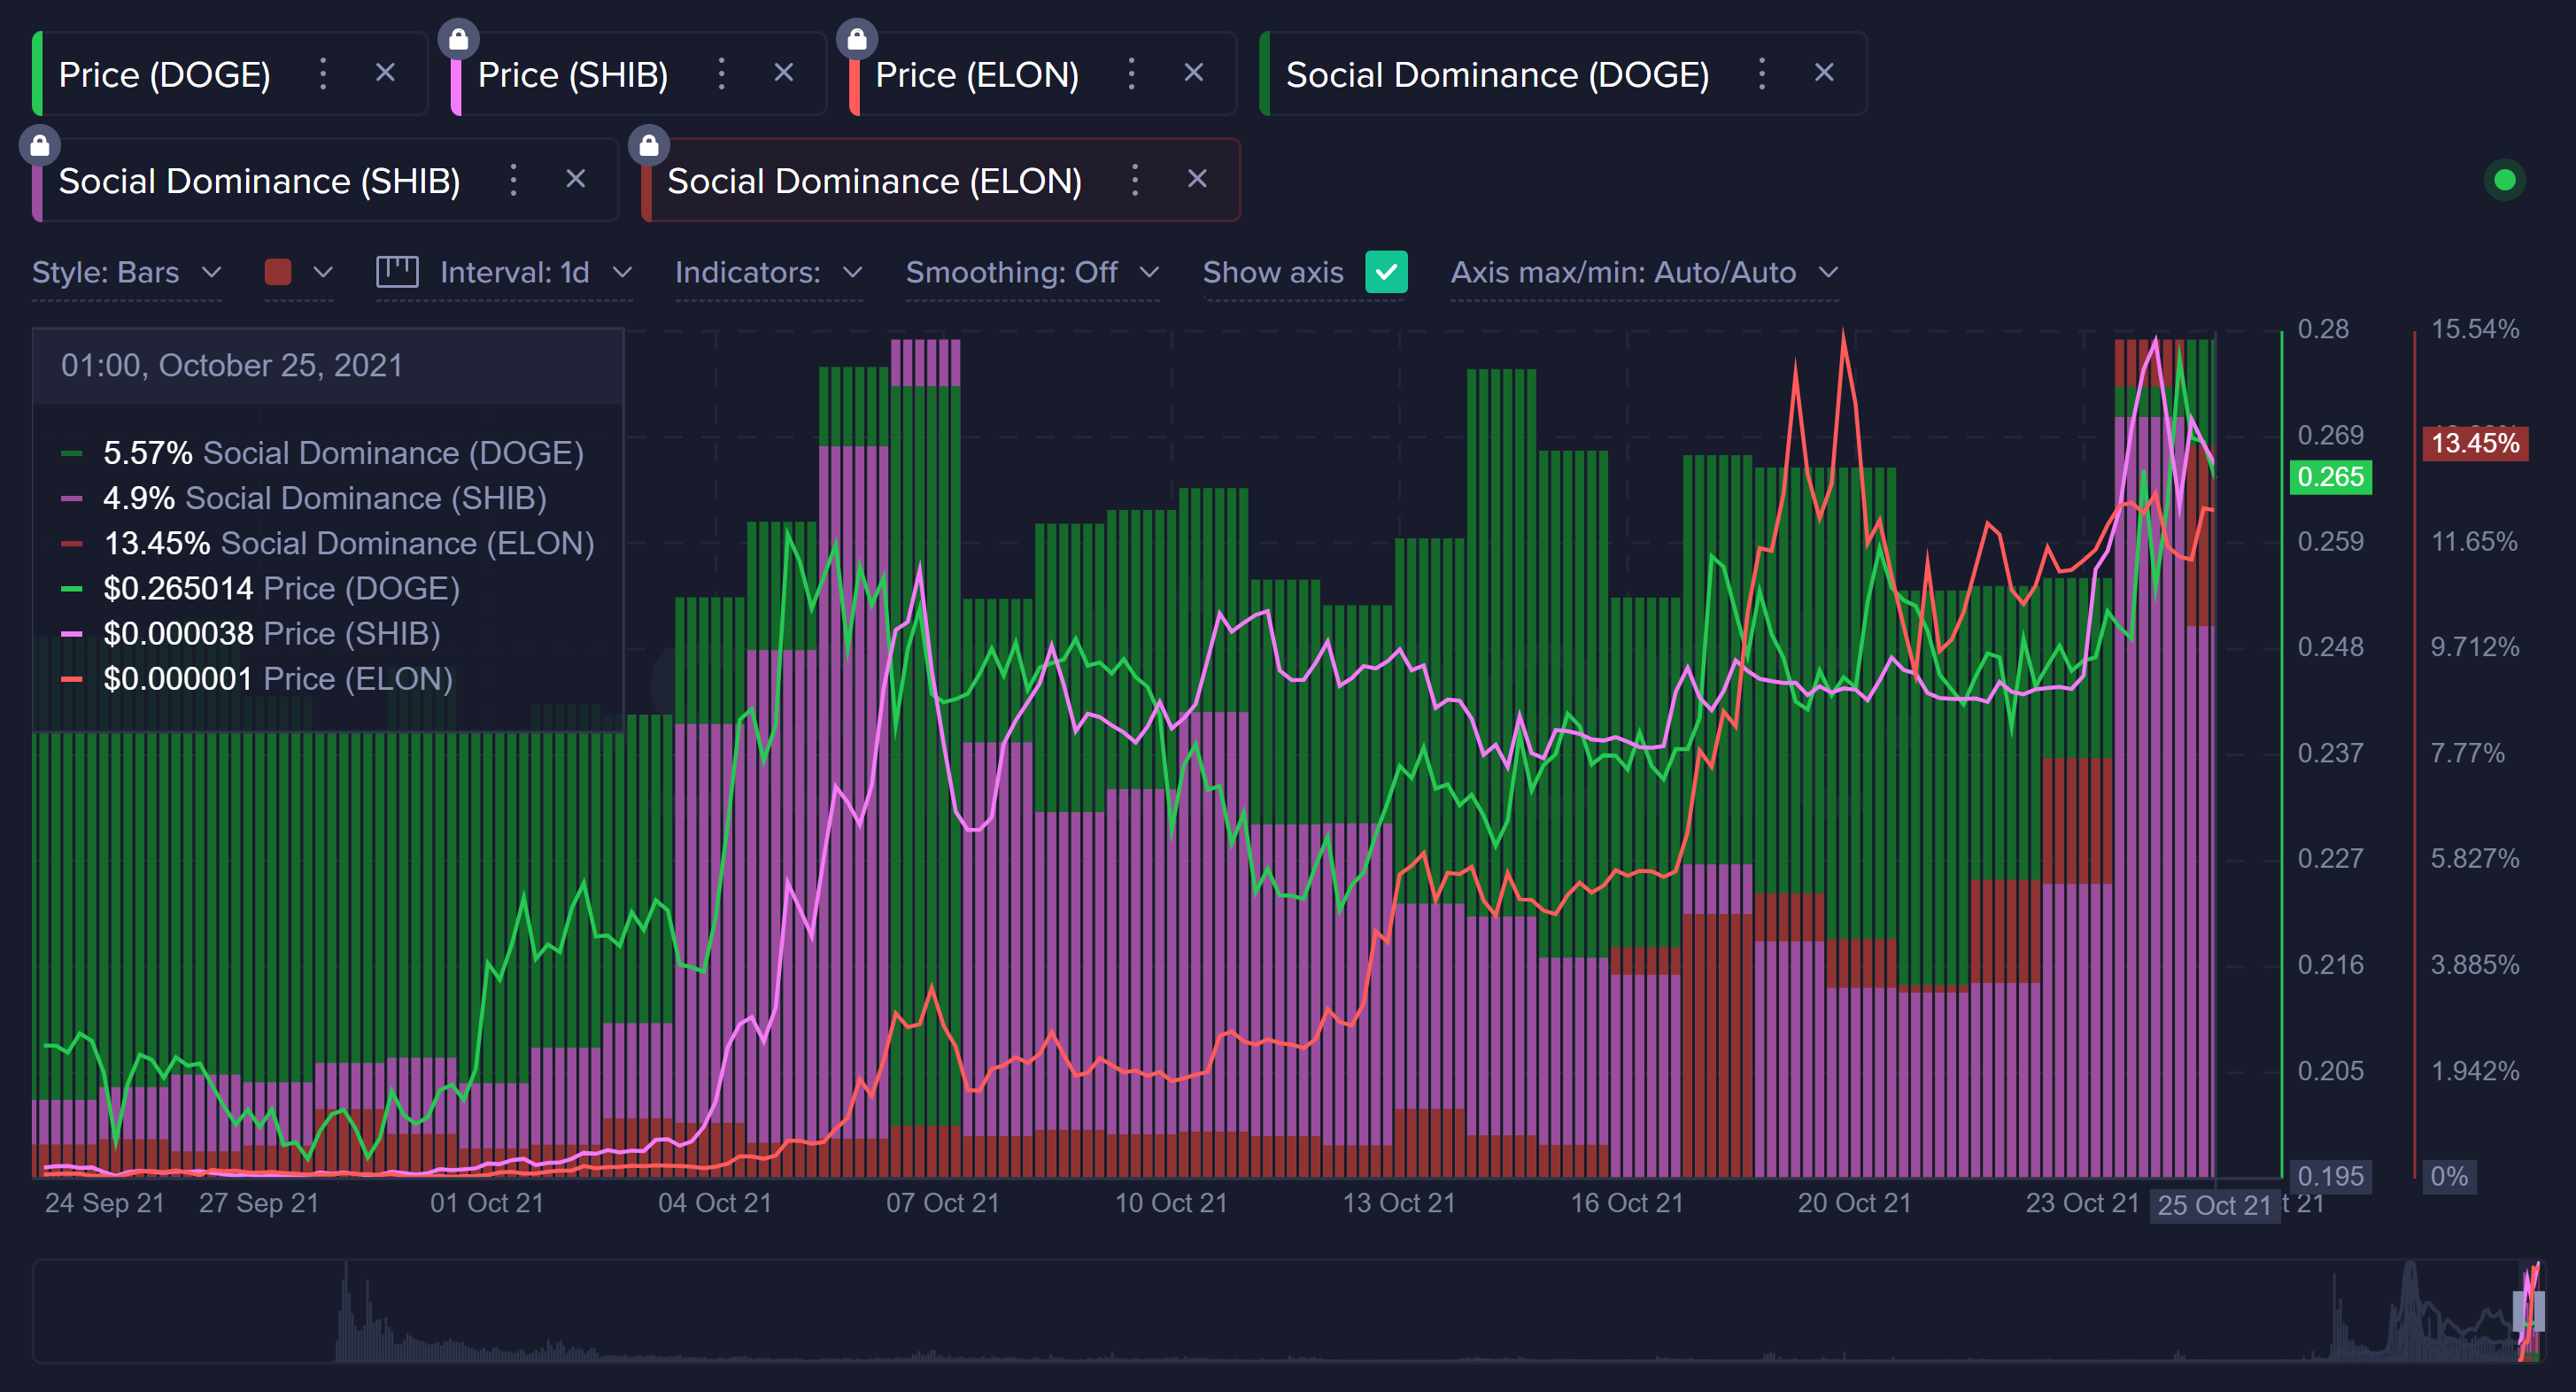
While the indicator in fact has a reverse correlation with the price of those assets, it only shows common accumulation and distribution cycles in which investors pick up assets only when retail traders are less interested in them.

But once the community picks up the hype and starts buying in, large addresses are taking profits and putting selling pressure on the asset, which leads to a rapid retrace down. While the coin is losing its monetary value, it also loses the retail trader's interest.
 Dan Burgin
 U.Today Editorial Team