During the last week, the Ethereum price has been far from the desired level. Traders are tired of waiting for another ETH rally, but here it is. The users of TradingView come up with very positive predictions – it seems like Ethereum will soon experience a great boost. What are these assumptions based on? Let’s take a look at the charts.
Extra fractal means ETH will grow
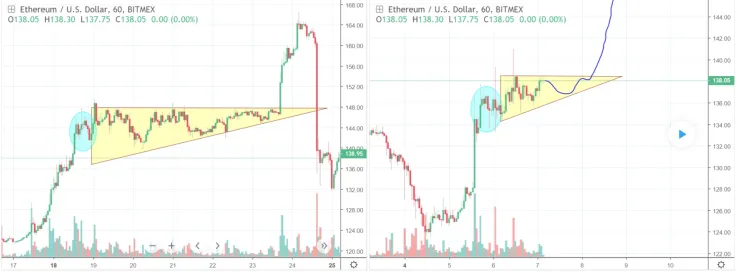
A user called botje11 made a thorough analysis and has reached an interesting conclusion. Just like Bitcoin, ETH mimics the path it has previously made during the rally from 100 to 165. However, the last time, the volume involved was much bigger prior to the triangles. In February, the rally was about 27 points, and this one seems to be 12 points only. ETH needs to gain momentum to repeat the rally.
Thus, Ethereum should reach the level of $132/$134 – it will be a good support zone for it to touch the $138.5/$139 level. If that happens, Ethereum will break eventually. Here’s what botje11 says about his prediction:
Unless we see a slow stable dropping of the price, I think I should give a small warning. I have been looking into some things, of this current bull flag. First thought was, it's a fake flag and it will probably drop again. However, this rally was not a short squeeze. Which is a very important difference. With each drop the past days, we see it getting bought up again, I just find I hard to tell if it's accumulation or distribution. If we continue to drop in a slow pace coming day or two, then I think we will break up eventually. So this channel you can see, is probably a good guideline to use. If we continue to move inside of, it should be seen as bullish.
Ethereum has been weaker than other altcoins due to lower trading volume, but it might enter the head and shoulders pattern. Even if we see drops in the current pattern and movement inside this wedge, Ethereum can still be bullish.
Ethereum is set to grow to $200
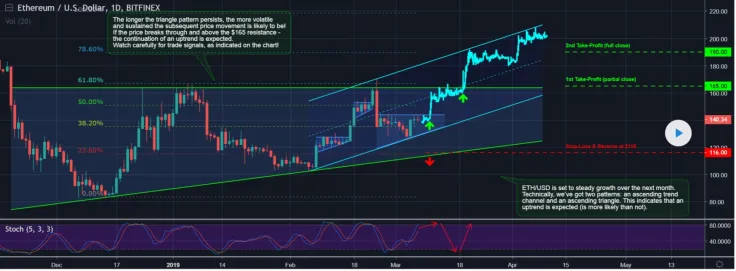
Ethereum price chart from Monfex
A user called Monfex predicts Ethereum will grow steadily during the next month. We can see two patterns: an ascending trend channel and an ascending triangle. Every pattern represents a continuation chart pattern and displays that an uptrend is expected (it’s very likely to happen).
We can also see an upward trend channel on a daily chart. The trendlines of this channel slope in an upward direction and the ETH price is making higher highs and higher lows. A very strong continuation pattern signals a great upward trend.
Monfex writes:
Also, there is an ascending triangle, as shown on the chart. The trendline connecting the high prices is horizontal at $144, and the trendline connecting the low prices forms an uptrend. What this pattern means is that market participants have been selling ETH at $144 over the past two weeks, always putting a halt to rallies at the same price point, but that buyers are getting more and more bullish and stepping in at increasingly higher prices to halt sell-offs instead of waiting for further price declines. We know that an ascending triangle typically forms in an uptrend and forms a powerful bullish signal. If the rally continues above the $144 (beyond the triangle), that will generate a strong bullish signal.
The prediction is also proven by a few technical indicators. We can see that in a daily time frame the Stochastic oscillator (5,3,3) is growing – it’s the confirmation of a buy signal. Fibonacci Retracement confirms all of the previous two impulse waves up and two corrective waves. Thus, a profitable $165 price is located at 61.8% of the Fibonacci sequence, and the 2nd target is located at 78.6%.
Thus, as soon as the price breaks through $165 resistance, we will witness the continuation of an uptrend. Here’s what Monfex recommends:
- Enter Long (Buy) now at $140.
- Set the Stop-Loss at $116 - the next significant support level.
- Set the Take-Profit (partial close) at $165 - the next significant resistance level. Close the position fully at $190.
- Forecasted P&L: +$43 or +30% (or +300% per 1 Lot with 10x Leverage)
- Risk/Reward Ratio: 1.8x
Bearish Butterfly sets $170 resistance level
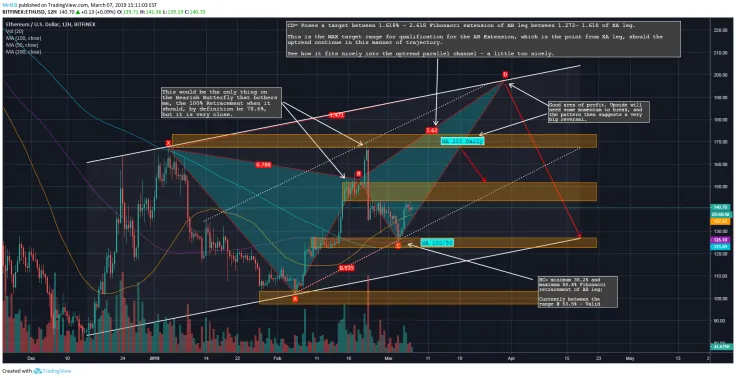
Ethereum price chart from MrJEB
Another pattern confirming ETH price suggestions is the Bearish Butterfly. It was revealed by MrJEB. It sets $170 resistance levels before reversing hard. Potential breakouts are possible and we should watch attentively for entry points.
Don’t miss the opportunity to double your riches with Ethereum – it might make a big jump this week and reach new heights in March.
Disclaimer: The opinion expressed here is not investment advice – it is provided for informational purposes only. It does not necessarily reflect the opinion of U.Today. Every investment and all trading involves risk, so you should always perform your own research prior to making decisions. We do not recommend investing money you cannot afford to lose.
 Dan Burgin