Disclaimer: The opinions expressed by our writers are their own and do not represent the views of U.Today. The financial and market information provided on U.Today is intended for informational purposes only. U.Today is not liable for any financial losses incurred while trading cryptocurrencies. Conduct your own research by contacting financial experts before making any investment decisions. We believe that all content is accurate as of the date of publication, but certain offers mentioned may no longer be available.
Epic crash or minor correction?
The difference between a market crash and a correction lies in their severity and duration. A correction is characterized by a gradual decline over several days, where prices drop by more than 10%. It indicates a temporary pause or reversal in an upward trend, often caused by exhaustion among bullish traders.
In contrast, a market crash is a sudden and severe decline in prices, typically occurring within a single day or even hours, resulting in a significant loss of value across the market. Crashes are often triggered by external events or systemic issues, leading to panic selling and widespread investor fear.

A cryptocurrency "flash crash" involves a sudden and steep decline in the price of a specific crypto asset, triggered by a surge in selling pressure. Unlike regular crashes, flash crashes see prices rebound swiftly, often returning close to their initial levels. These events are difficult to explain fully, and afterward, there is often speculation within the crypto community about the cause or catalyst behind the crash.
Greed
Fear and Greed Index provides a comprehensive measure of sentiment in the cryptocurrency market, ranging from 0 to 100. A low score indicates overselling, while a high score suggests a potential market correction.
Extreme fear may present opportunities for market engagement, as investors are overly concerned, while extreme greed could signal a shift in market conditions. Low index values may indicate potential price increases, guiding traders in their engagement strategies.
Conversely, high index values may indicate a need to reassess market conditions. Understanding these dynamics helps traders incorporate additional data and improve their grasp of market dynamics for informed decision-making. Currently, the indicator for Bitcoin is at “Extreme Greed.”
Huge whale movements
It is crucial to monitor the behavior of large holders, or "whales," in the cryptocurrency market as they can influence prices and potentially engage in manipulative practices. Additionally, staying informed about the ongoing technological developments and potential vulnerabilities in blockchain networks is essential.

Realized price provides valuable insights into potential price movements for Bitcoin. This metric calculates the average price at which Bitcoins were acquired by different types of wallets on the blockchain, such as whales holding between 10 and 100 BTC.
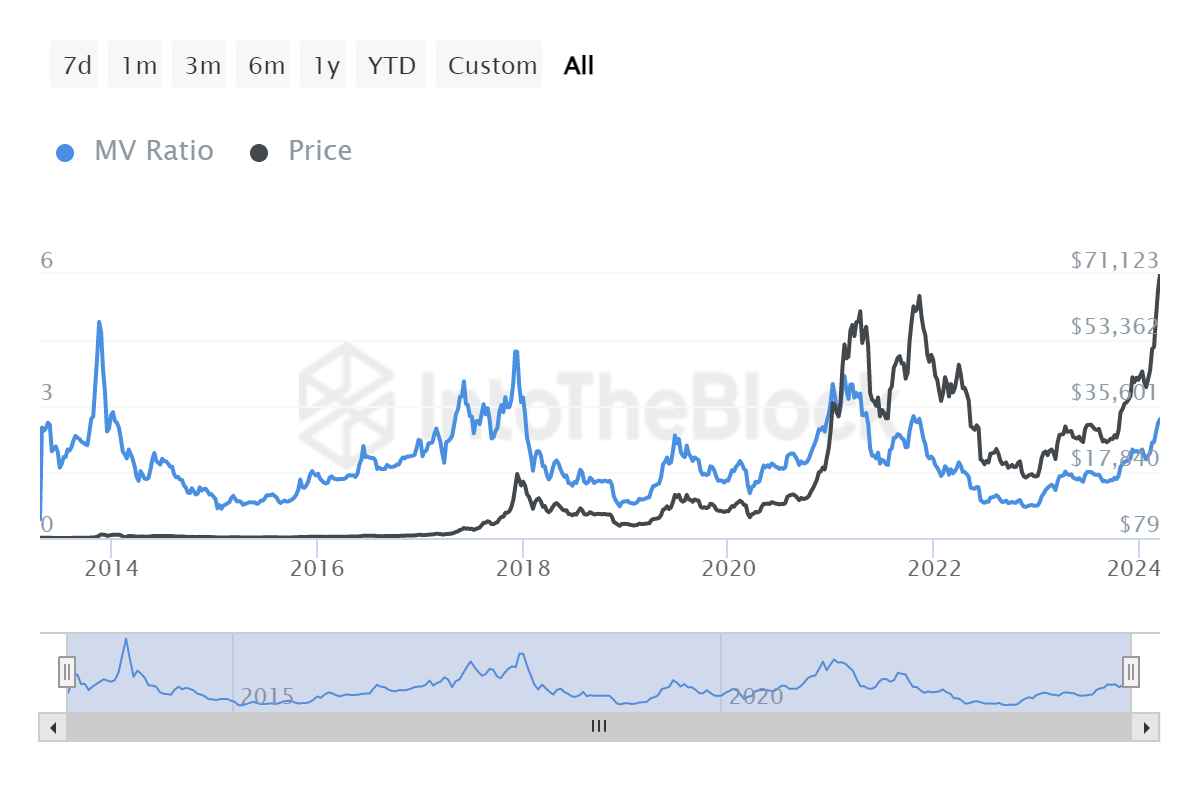
Realized price is widely regarded as a more reliable metric for gauging the "true" value of a cryptocurrency. It serves as a valuable tool for investors and analysts looking to gain deeper insights into the market.
RSI
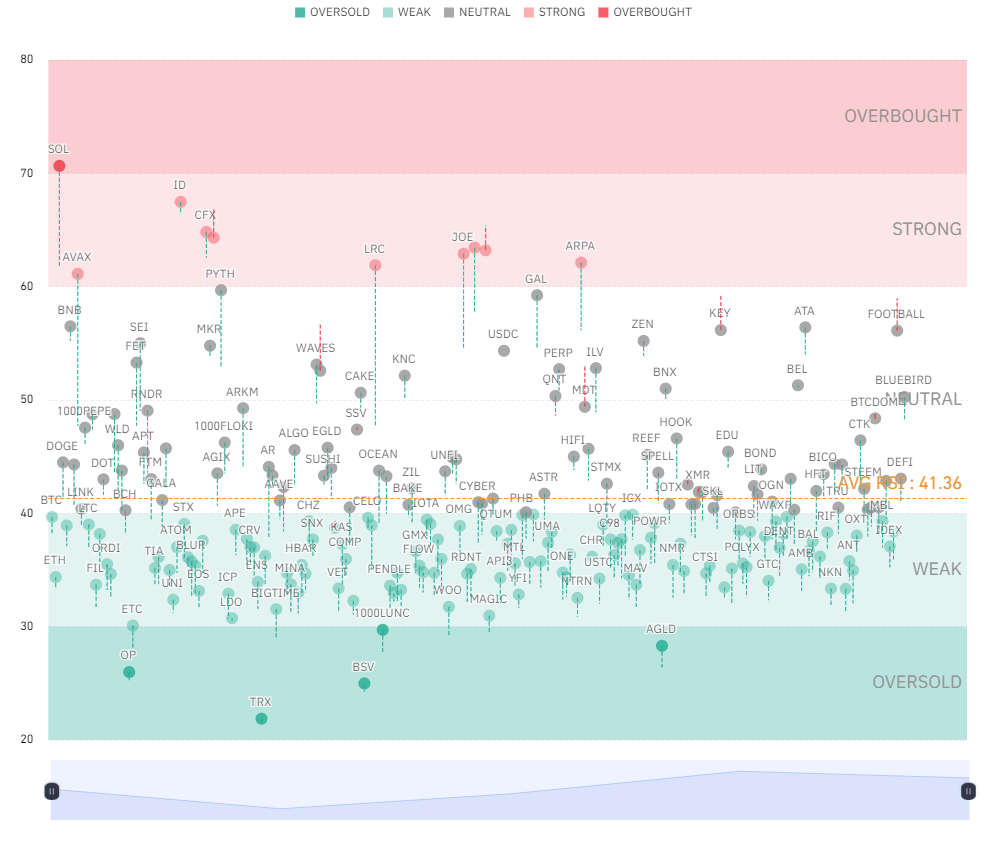
RSI, or relative strength index, measures the strength of buying pressure compared to selling pressure on a scale of 0 to 100. Higher RSI values typically indicate stronger buyer control and a robust uptrend. However, when RSI values become excessively high across the cryptocurrency market, it may indicate overheating and signal an impending sell-off.
When the average RSI value surpasses 70 and enters the "overbought" territory (highlighted in red), the likelihood of a market pullback increases. It is important to note that the market can remain overbought for extended periods, with prices continuing to rise.
Low trading volumes
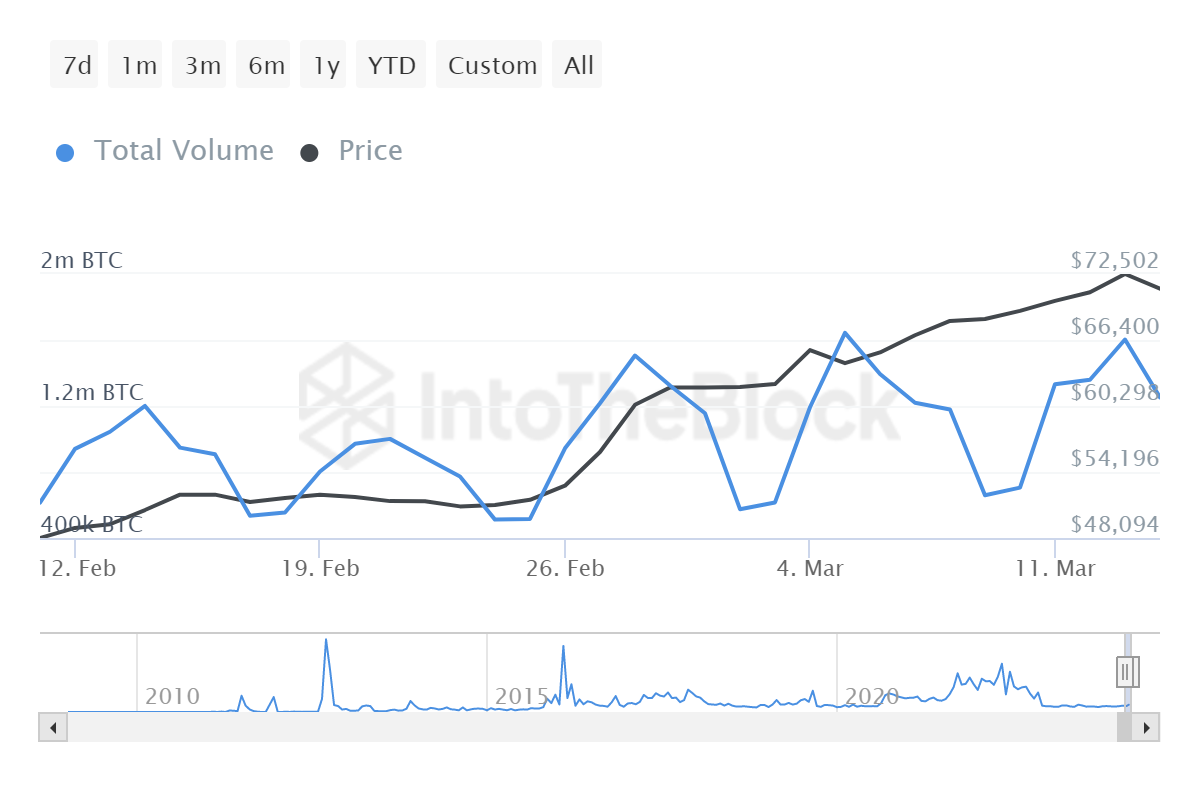
Indeed, a sudden decline in trading volumes and liquidity serves as another red flag in the market. This decrease could signal a loss of confidence among investors and a decrease in overall market activity.
With reduced liquidity, markets become more susceptible to price swings and volatility, potentially paving the way for a market crash. Therefore, monitoring trading volumes and liquidity levels can provide valuable insights into the health and stability of the market.
Regulatory measures
In 2022, cryptocurrency markets faced increased regulation in major countries like China and the United States, resulting in stricter rules. This trend contributed to the beginning of the "Crypto Winter." For instance, exchanges such as Bittrex were compelled to cease operations.
In August that year, the California Senate passed a bill mandating new licensing for cryptocurrency firms operating in the state. This legislation prohibits California entities from trading in stablecoins unless they are licensed by a bank with secure reserves or approved by the California Department of Financial Protection and Innovation.
The bill also stipulates that stablecoins lacking proven reserves and state licensure cannot be traded in California, essentially banning most existing stablecoins from the state's market.
 Dan Burgin
 U.Today Editorial Team