Disclaimer: The opinions expressed by our writers are their own and do not represent the views of U.Today. The financial and market information provided on U.Today is intended for informational purposes only. U.Today is not liable for any financial losses incurred while trading cryptocurrencies. Conduct your own research by contacting financial experts before making any investment decisions. We believe that all content is accurate as of the date of publication, but certain offers mentioned may no longer be available.
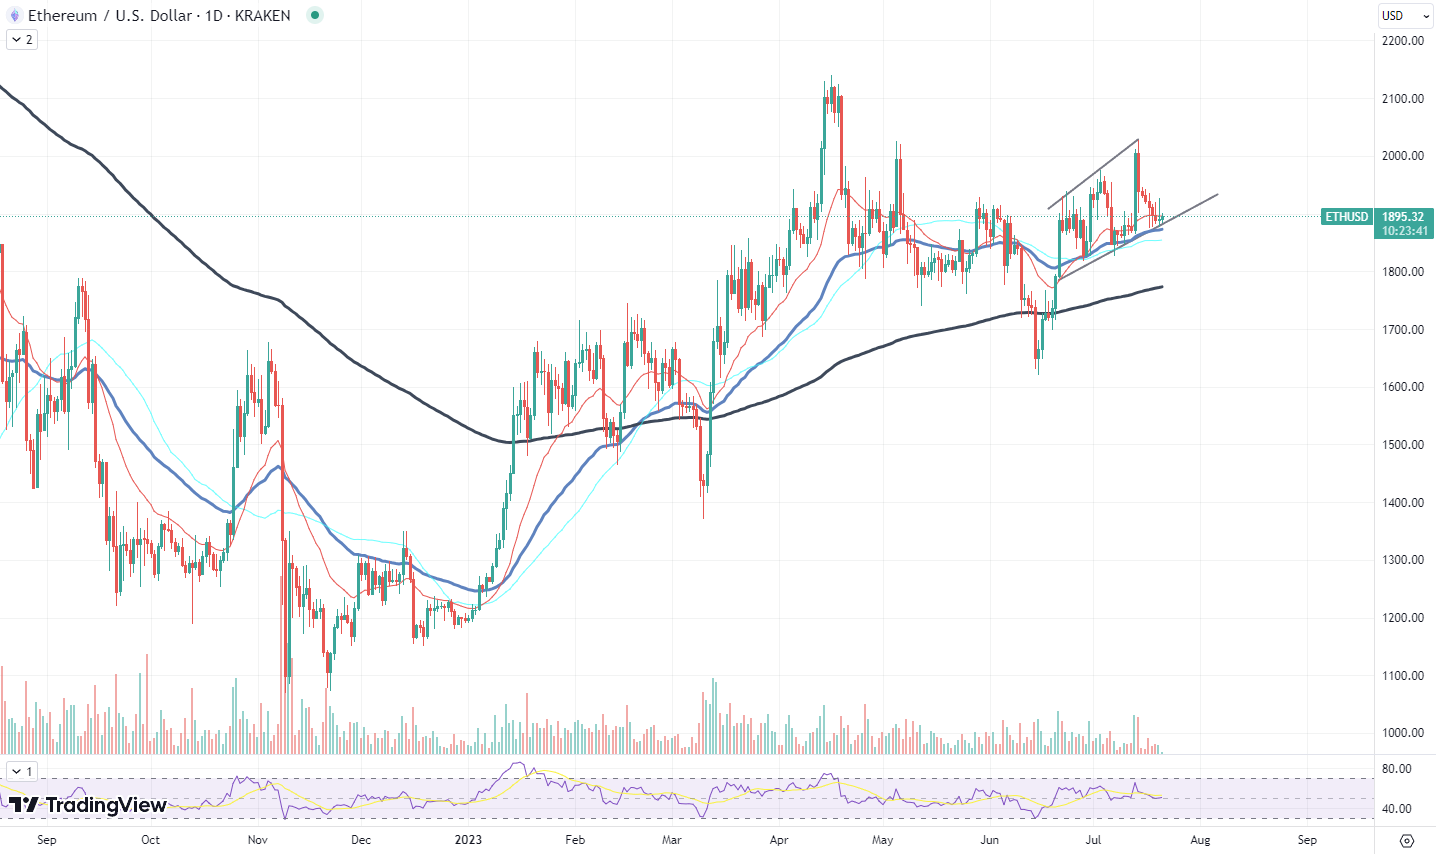
Recently, Ethereum has entered the ascending price channel, a pattern typically associated with an ongoing bullish trend. An ascending channel is characterized by two parallel trend lines, both slanting upward at the same angle, with the price oscillating between the upper and lower bounds.
Currently, Ethereum is situated at the lower border of this channel. In previous instances, a touch at the lower trend line within this pattern often precedes a rally toward the upper boundary. If Ethereum follows this pattern, we could expect a bullish move in the near future.

However, it is important to note that Ethereum recently experienced a breakdown from the $2,000 level, a psychological barrier for many traders. This could apply some downward pressure on ETH. Yet, the current position on the ascending channel's lower border may provide enough support to counteract this bearish factor.
Additionally, the Relative Strength Index (RSI) - a popular momentum indicator - is presently hovering around the neutral 50 mark for Ethereum. This level often serves as a demarcation line between bullish and bearish market conditions. Notably, the RSI is maintaining its level above 50, implying that the prevailing uptrend could still have some steam.
Lastly, Ethereum's recent volatility appears to be lower than usual. In the world of cryptocurrencies, a decrease in volatility can often be a precursor to a significant price movement. A sudden surge in volatility could therefore potentially trigger a strong price swing for Ethereum.
Shiba Inu is asleep
In the world of meme cryptocurrencies, Shiba Inu (SHIB) has held a significant place, with a community that is known for its zeal and resilience. However, recent market trends suggest dampening energy surrounding this token, with volatility significantly waning, putting SHIB in an anemic state.
SHIB recently encountered a critical resistance level, which typically represents a price point that an asset struggles to break above due to heightened selling pressure. Unfortunately, as it stands, the token is experiencing a rapid reduction in volatility.
An asset without volatility may become less attractive for traders looking to capitalize on price swings. Therefore, the diminishing volatility of SHIB could lead to a potential increase in selling pressure, which is the last thing SHIB needs at this crucial juncture.
The current status of SHIB paints a picture of a token that is losing momentum. Unless the scenario changes - with an influx of positive news or an increase in its adoption - the current anemic state could continue.
PEPE's bounce is possible
The meme-based cryptocurrency market has often showcased its unpredictable nature, with sudden price movements keeping investors and traders on their toes. One such crypto asset, Pepe (PEPE), a popular meme token, has been showing signs of a potential upward price trajectory. PEPE has once again touched its local low at approximately $0.0000015, an event that has historically led to price reversals.
This local low coincides with a 50 Exponential Moving Average (EMA) support level, as well as a support line on the token's local trend. The Exponential Moving Average is a type of weighted moving average that gives more weight to the latest data. In PEPE's case, the token's price has come to rest on this 50 EMA line, suggesting that it could potentially be in for a price boost.
Moreover, this is not the first time such a price pattern has been noticed for PEPE. In the past, similar falls to this threshold have led to relatively swift price reversals. If the past is any indicator, and if the pattern continues to hold true, PEPE may be poised for a 10% run upward from its current position.
Of course, any such prediction is contingent on a number of factors, including overall market sentiment, investor interest and the general performance of meme-based cryptocurrencies. With that said, the recent trend and historical data for PEPE give investors some cause for optimism.


 Alex Dovbnya
 Denys Serhiichuk
 Gamza Khanzadaev
 Tomiwabold Olajide