Disclaimer: The opinions expressed by our writers are their own and do not represent the views of U.Today. The financial and market information provided on U.Today is intended for informational purposes only. U.Today is not liable for any financial losses incurred while trading cryptocurrencies. Conduct your own research by contacting financial experts before making any investment decisions. We believe that all content is accurate as of the date of publication, but certain offers mentioned may no longer be available.
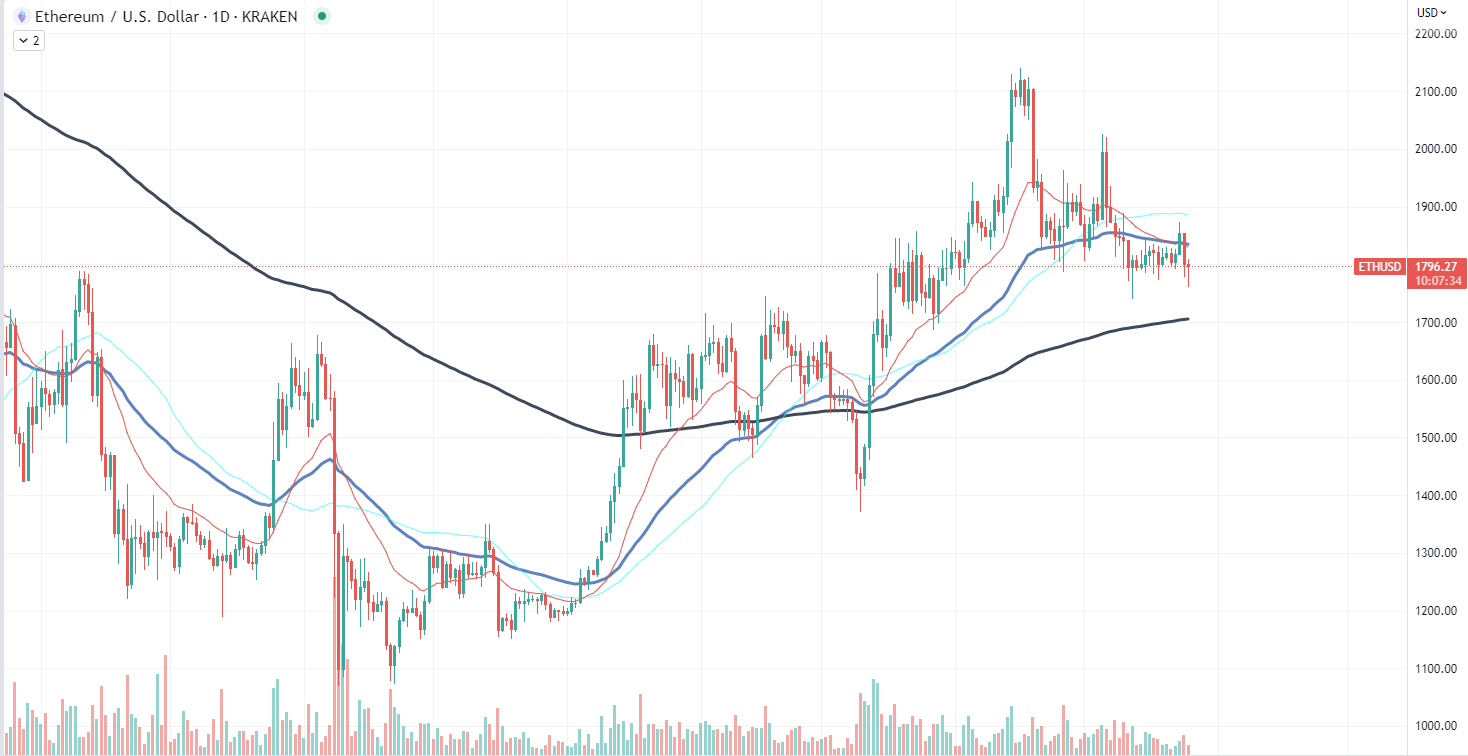
In a striking setback for Ethereum, the second largest cryptocurrency by market capitalization, the token has slumped below the significant price point of $1,800. This development is particularly disappointing to investors who were anticipating a substantial recovery in the near future.
Despite robust project development and a thriving DeFi and NFT ecosystem on the Ethereum blockchain, the price of ETH has faced a downward spiral, falling below the critical $1,800 level. The descending volume accompanying this drop could indicate that the asset might face increased selling pressure in the coming period.

As Ethereum continues its downward trend, it is approaching its next line of support, the 200-day exponential moving average (EMA). This is a widely followed technical analysis tool that smooths out price data by continually updating the average price over a given period. The 200 EMA is particularly influential, often acting as a major support or resistance level on the market.
With ETH now trading below the $1,800 level, the 200-day EMA becomes a crucial point to watch. If the price manages to rebound from this level, it could signify a bullish reversal. However, if it fails to find support here, it could further descend into a bearish market condition.
Shiba Inu falls back
In the world of meme coins, Shiba Inu (SHIB) has seen its fair share of tumultuous trading recently. Despite positive movements on the broader market, the token recently lost 7% of its value after it nudged the 21-day exponential moving average (EMA), an important resistance level, but failed to break through it. This development is notable, as it signals that bulls might not be in control of the current rally.
The 21 EMA often serves as a critical technical indicator that traders use to determine the short-term trend of an asset. In SHIB's case, this recent rejection at the 21 EMA is indicative of the bearish sentiment still prevalent on the market. This could spell trouble for the meme coin, as failing to breach this resistance level could potentially lead to further downward price movements.
The fact that SHIB experienced a sharp 7% price drop immediately after slightly touching the 21 EMA suggests a lack of buying power to propel the token above this level. It is a disappointing development for SHIB bulls who had hoped for a sustained rally and a break above this crucial resistance.
Looking ahead, the SHIB market will closely watch the 21 EMA line. A sustained break above this level could signal a change in the trend from bearish to bullish. However, if SHIB continues to struggle at this level, it may need to find support at lower price levels to avoid further losses.
Cardano slips
Cardano (ADA) recently lost a crucial ascending trendline support, a negative development for the digital asset as its profitability has dropped to a mere 12%. This key event underlines the persistent bearish pressure surrounding ADA.
The profitability of an asset plays a critical role in attracting and retaining investors. When profitability plummets, as in Cardano's case, it can discourage new investment and even prompt existing investors to liquidate their positions. The low profitability of ADA suggests that the return on investment for holding the asset has diminished significantly, raising questions about its near-term potential.
Declining profitability, coupled with ADA's breach of its ascending trendline, poses a double whammy for the asset. The ascending trendline has historically served as a vital support level for ADA, allowing the price to bounce back during downward movements. However, the recent break below this trendline indicates that the selling pressure has outpaced buying pressure.
Another concern is the declining trading volume for ADA. A high trading volume typically signifies strong investor interest and can provide the necessary liquidity for an asset's price to move.


 Alex Dovbnya
 Arman Shirinyan
 Dan Burgin