Good times for Tron have only started: many traders start being bullish about the TRX market, and they have a ton of reasons for that. Why is TRX said to grow in the nearest 10 days? What will drive its growth? Let’s check Tron price analyses and tech indicators from TradingView users.
Ascending wedge scenario
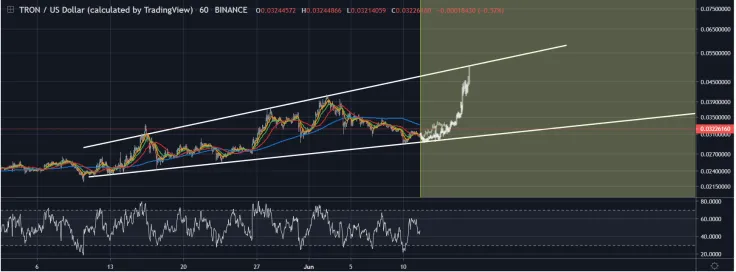
TRX/USD has been trading above the low $0.02 range ever since early to mid-May. Since then, an ascending broadening wedge has formed, and new highs in the $0.03 and a low $0.04 range have been seen. We have since corrected downwards from those highs.
We need another confirmation of support at the lower bound of the wedge for the sake of pattern continuation. If the pattern is validated at that point, a move up should be made to test the upper bound of the wedge at the high $0.04 to low $0.05 range. Should this happen, a test of new highs should be seen in 5 to 10 days.
If the pattern breaks below the broadening ascending wedge, TRX/USD would likely return to the low $0.02 range that it was consolidating between February and May.
How to maximize gains?
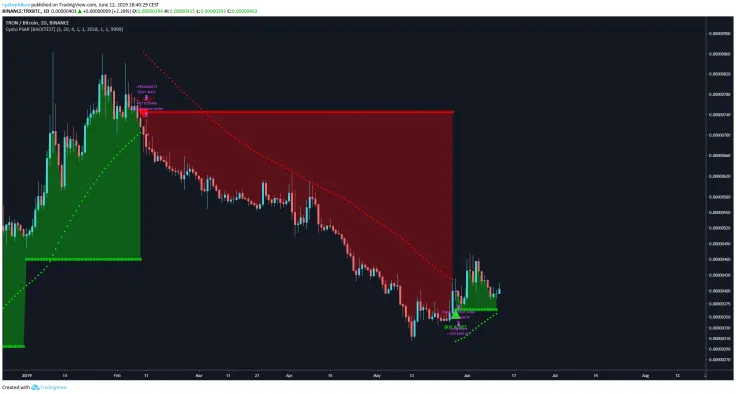
If you want to trade safely, wait until we clearly exit this descending channel. But if you want to maximize profits, look at divergences in the indicators.
RSI is not looking too overbought, so it's a good sign for buyers. And look at how the RSI is going up just now. Parabolic SAR indicator reversed a few days ago, had a pullback, but it's looking like bouncing on this support being created.
On the 4 hour chart, a nice ascending channel is forming. With last's week price action, it made a solid triple bottom. Another indicator that we should consider is the combo of Donchian channels and Tilson T3 line.
There is only one counter-argument to all these bullish indicators: Bitcoin is showing a huge Head and Shoulders, and we know that when Bitcoin collapses, alts tend to collapse as well.
Long setup for TRX/BTC
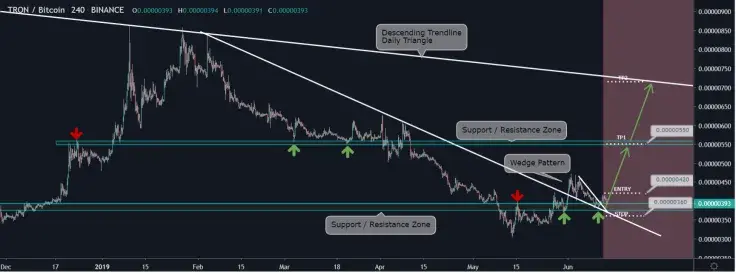
We can see that TRX/BTC is definitely set for growth.
What we can see on the 4h chart:
-
Price broke out from a descending trend line and started a Wedge Pattern formation.
-
Wedge Patterns are considered reversal structures.
-
The Wedge Pattern is supported by a major support/resistance level and the broken descending trend line.
Based on this we expect the price to continue the bullish movement towards the next resistance level at 550 satoshi.
So, how to trade TRX now?
-
Entry price: 0420
-
Stop price: 0360
-
Take Profit: 0550
If the Stop is hit, we should see if the intention of the price was to make a fake out or a bearish movement, after that we will consider whether re-entry makes sense.
Tron is ready to go!
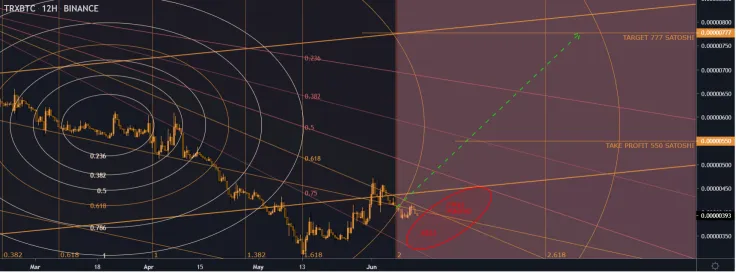
Recently, we observed TRX retracing from its last impulse wave, finally settling down in this Fib channel where it has began to show signs of bubbling – right on time.
Analyzing the last impulse wave, we see that Tron is attempting to fight its way back into the Fib channel above. 7 days ago, it entered the 200% Fib Time Zone. In the past, this has been the cause for significant influence on price. We can see a strong reaction from this time zone. Morever, you see sloping downwards Fibonacci speed resistance, indicating that this is a crucial moment as Tron begins to grind against the .618 line.
Also, take a look at the Fibonacci Circles, which provide an exciting insight into the effect of time on the chart. Tron has been forced to move up as it nears ever closer to the Fib Circle's 1.618 Golden Ratio
TRX should definitely make a pop! The first take profit is 550 – 575 satoshi, the final target is 777, however, TRX has the potential to go much higher.
Tron price charts by TradingView


 Arman Shirinyan
 Alex Dovbnya
 Tomiwabold Olajide