Disclaimer: The opinions expressed by our writers are their own and do not represent the views of U.Today. The financial and market information provided on U.Today is intended for informational purposes only. U.Today is not liable for any financial losses incurred while trading cryptocurrencies. Conduct your own research by contacting financial experts before making any investment decisions. We believe that all content is accurate as of the date of publication, but certain offers mentioned may no longer be available.
According to the Crypto analyst Lark Davis, Bitcoin is about to record its ninth death cross in its short history. The "death cross" is deemed a bearish indication, and it appears when the daily moving average (MA) 50 falls below the daily (MA) 200.
As per the analyst, there have been eight death crosses in BTC's history, of which four marked the bottom and four preceded sell-offs ranging between 30% and 65%.
#bitcoin is about to hit the much feared "death cross"... but does it matter?
— Lark Davis (@TheCryptoLark) January 13, 2022
Well, there have been 8 death crosses in BTC's history. 4 marked the bottom (approximately), and 4 came before sell offs of 30, 60, 61, and 65%.
What will death cross number 9 have in store for us? pic.twitter.com/RHmE3ulEMp
That said, the technical indicator's history of bear market prediction is uneven, with a 50% success rate. Previous death crosses, which occurred in 2014 and 2018, were followed by a sell-off in the days that followed.
However, death crosses seen in June 2021, late March 2020 and October 2019 were, on the other hand, bear traps or false signals signaling major price bottoms. The death cross in October 2019 triggered a 42% pump the day before, while the consolidation following the death cross in June 2021 culminated in a new bull run.
Since moving average crossovers are based on backward-looking data and thus lagging indicators, they cannot be employed as standalone indicators. By the time the crossover is confirmed, the market is frequently oversold and due for a bounce, as it was in June 2021 and late March 2020.
As earlier reported by U.Today, Bitcoin rose to highs of $44,342 on Jan. 12 following the release of fresh inflation stats. The Consumer Price Index rose by 7% during the year through December, the highest since June 1982.
Analysts opine that Bitcoin's next stop might be a retest of $46K. At the time of publication, Bitcoin trades at $43,941, up 2.61% in the last 24 hours as per CoinMarketCap data.
Bitcoin (BTC) price action
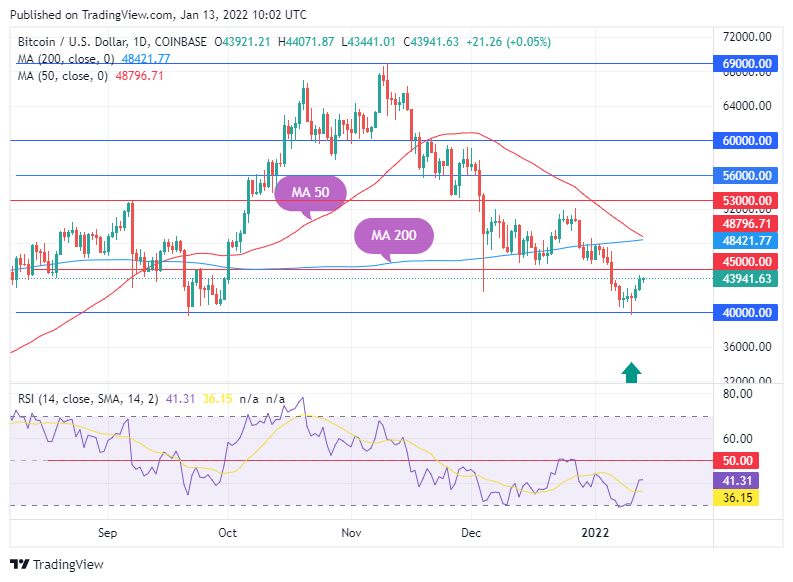
Bitcoin (BTC) is recovering after briefly crossing the $40,000 support for the first time since September 2021 on Jan. 10, reaching lows at the $39,650 level. The rebound of $40,000 comes with a bullish dragonfly Doji candlestick as strong support. Risks to this outlook persist, although the pair might become rangebound over the next few days.
The uptick in the price may continue to erase losses for the third straight day. The outlook, therefore, seems to have turned neutral, endorsed by the moving average (MA 50) about to cross below the moving average (MA 200) to form a "death cross." That said, a sustained break below $40,000 would be required to confirm the continuation of a downtrend.
On the upside, the first obstacle for bulls might be the $45,000 area. If they overcome it, the next target would likely be the $48,000 zone, where another positive break could open the door for a test of the psychological zone at $50,000.
 Dan Burgin
 U.Today Editorial Team