*** Please note the analysis below is not investment advice. The views and opinions expressed here are solely those of the author and do not necessarily reflect the views of U.Today. Every investment and trading move involves risk, you should conduct your own research when making a decision.
Bitcoin possible ‘short’ area
After the Sept. 9 inverted "hammer," yesterday we got a green candle close. Yesterday’s candle closed above the mentioned strong level $6,250 but the volume is very low to get any information from this candle.
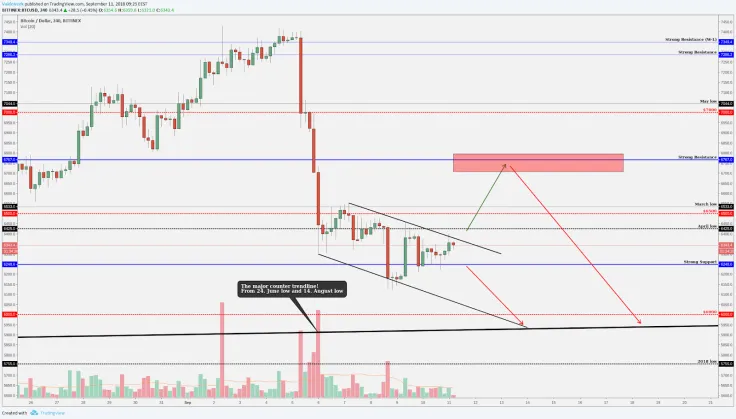
In the four-hour chart, we could see that we are still moving downwards in the down channel which will guide us to the $6,000 level and there is also the major counter trendline. So, at the moment, we can't make any precise prediction because the signs are just too unclear. We have to wait for this level or better price action from the current level.
In the four-hour chart BTC still makes lower highs and lower lows but if you zoom in, then in the shorter timeframes there is a sign which will tell us that the small price structure could change because there we can see some lower highs which tell us that buyers don't want to let the price down and we could see a bounce upwards.
If we break upwards from the current channel then technically a good short opportunity- short opportunity, because our bias is bearish based from the previous week candle close (yesterday's post)- would be around $6,700-$6,800 and the area criteria are:
- The Fibonacci retracement 50 percent (pulled from Sept. 5 to Sept. 6)
- The Fibonacci extension 141 percent to 161 percent (pulled from Sept. 7 to Sept. 8)
- Strong resistance area $6,787-$6,800
- Different timeframes EMA's starts to work as resistances
Currently, our recommendation is, stay away from the market and wait for those levels that we mentioned above. From these areas, we can make better decisions but let’s look at what the few altcoins charts show us.
Ripple (XRP/USD) possible "double bottom"
Currently, Ripple trades between the $0.25 and $0.3 levels. The short-term price structure is still lower highs and lower lows but the chart shows us that it slowly starts to slow down after the drop from $0.35. A first possible support is the August low/ 2018 low and the round number area $0.25. If it finds support from this area then we have also a bullish chart pattern called "double bottom" and currently looks like the channel guide us into this area.
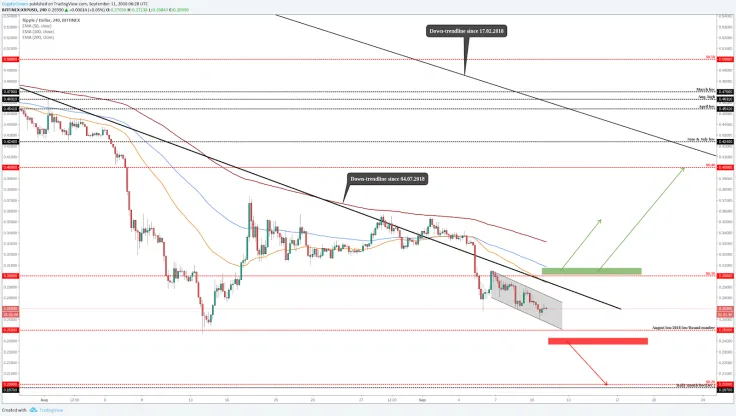
To enter the market from the mentioned area we have to watch what Bitcoin does, if it also shows us some positive signs then definitely this is a place where Ripple may bounce upwards.
Upwards target would be the trendline which is pulled from July 4th’s wick. This trendline starts to work as a resistance and if we get a candle close above the trendline and above the round number $0.3, then we have an almost free ride to the $0.35 or $0.4, depends how healthy the market is.
Bearishness will be confirmed if we get a candle close (at least four-hour) below the August low which matches almost exactly with the round number $0.25, then this is our confirmation and we can be almost certain that XRP' could drop as low as $0.2. There is the rally month low (December low), historically nothing more and the psychological number. The rally month low- December last year's rally started from this area! So, if we drop below the $0.25 next stop would be around $0.2.
DASH (DASH/USD)looks good compared to other alts
Currently, DASH trades above the round number $200. After the massive market drop and after the tough weekend, DASH shows us positive signs.

First of all the rare case is the EMA's, in the four-hour chart we trade above the all-important EMA's (50, 100, 200).
If you look at the monthly chart then there we could see that we got a bounce upwards from the 50 EMA. This worked as a support and now if the market stays stable for a while then we could beat the blue trendline, which is almost the last down-trendline on DASH’s chart.
If we break above the trendline then the next strong area would be around $230. There are the August high point and the area where the price started the last year's rally upwards.
Let's call this area the August high, this strong price level has worked historically very nicely and we can read this area to our key area. After the breakout above this price level could mean that Dash has good times ahead, we make a new clean higher high and ready to climb upwards.
Currently, the price shows us (even in this tough market situations) very nice price action but if we want to confirm bearish price action then it would be a candle close below the short blue up-trendline. In this case we traded above the EMA's, we broke the minor trendline and it made a new short-term lower-low, this means that it 'wants' to go and retest the lower prices around $125.
 Dan Burgin