Disclaimer: The opinions expressed by our writers are their own and do not represent the views of U.Today. The financial and market information provided on U.Today is intended for informational purposes only. U.Today is not liable for any financial losses incurred while trading cryptocurrencies. Conduct your own research by contacting financial experts before making any investment decisions. We believe that all content is accurate as of the date of publication, but certain offers mentioned may no longer be available.
The creation of the Strategic Bitcoin Reserve failed to meet the expectations that many crypto market participants had for it, and as a matter of fact, the main cryptocurrency came to a close this week without 10.66% of its valuation at the beginning.
What's next for Bitcoin (BTC)? If anyone were to give you a concrete answer, they would be lying.

However, there is a way to at least build expectations, and these are indicators, one of which is the Bollinger Bands. The popular tool for financial instruments invented by John Bolinger has long served as a benchmark for all types of assets, and BTC is no exception.
Consisting of three curves, or bands, the indicator presents a range movement that helps traders estimate if the instrument is oversold or overbought. In addition, it helps to identify the bias that currently prevails for the asset and to identify potential critical price points.
Bad and worse
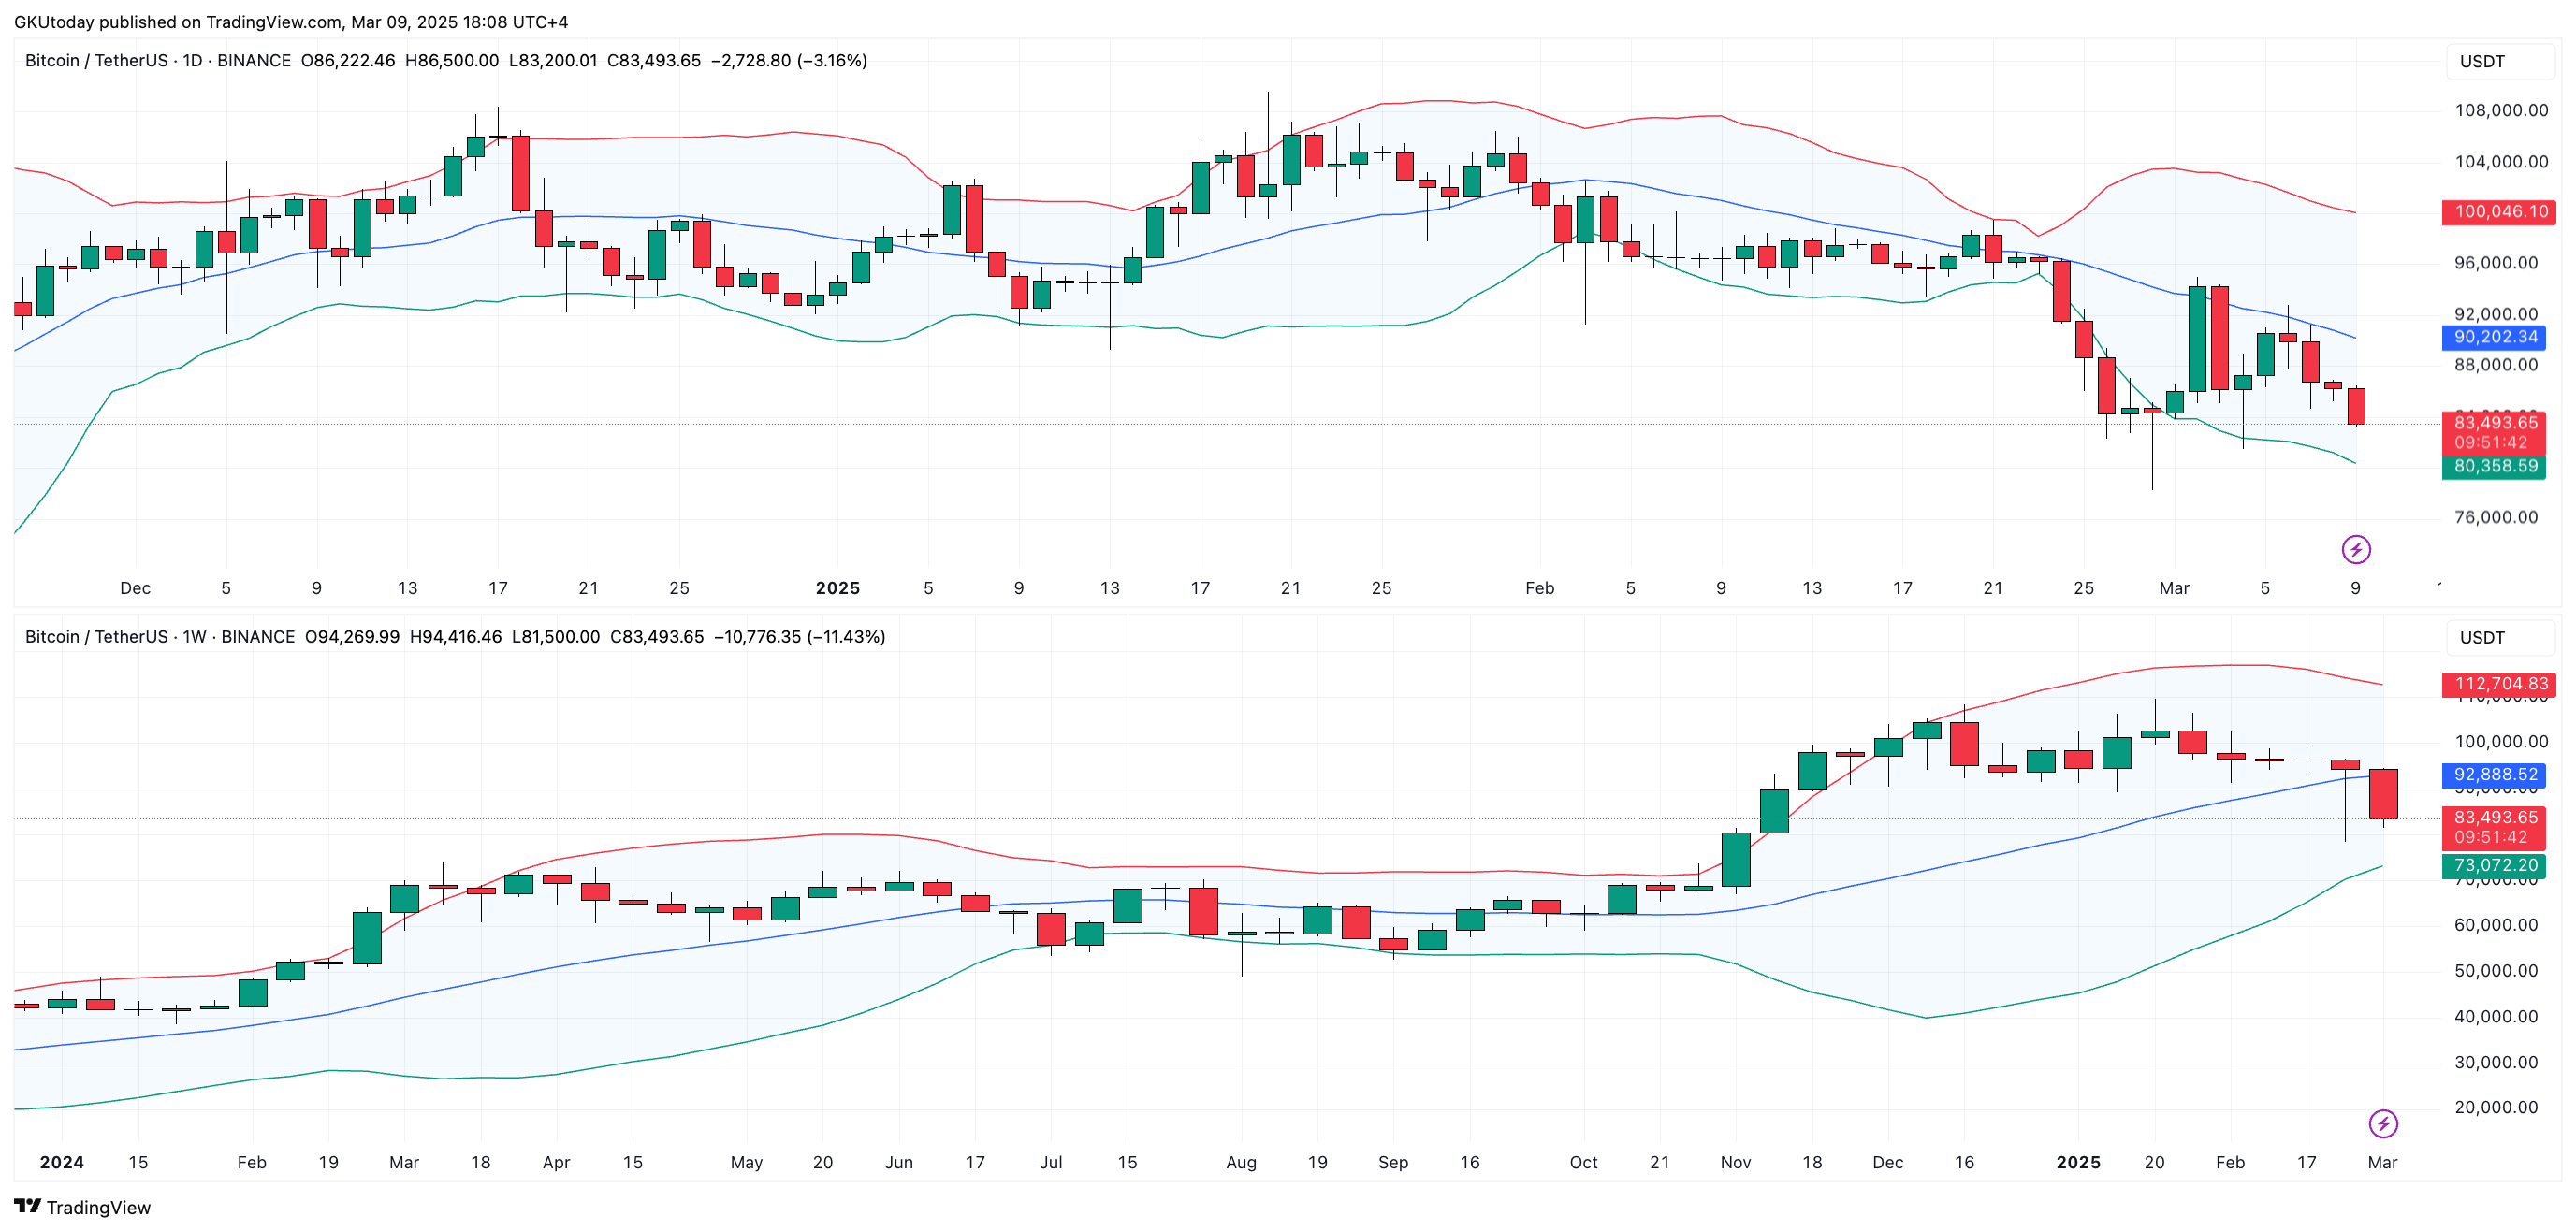
For Bitcoin, the picture painted by the Bollinger Bands is quite eloquent, and not in a good way. If we take a look at the cryptocurrency's daily chart, we can see that Bitcoin is currently stuck between the middle band and the lower band, which stretches above the $80,411 level.

Such a situation makes the BTC price vulnerable to another 4% drop to the lower border of the range outlined by Bollinger Bands. What can change the situation is if, in the next few hours, the price of Bitcoin will be able to rise above the middle band at $90,200.
An 8% jump in a few hours on Sunday? One could say it is highly unlikely.

Unfortunately, the weekly time frame presents an equally bad picture, but on an even larger scale. There, Bitcoin is also between the middle and the lower band, but the latter is currently at $73,000. So, if nothing changes in the medium term, it is a 12.3% drop for Bitcoin as a major scenario by the Bollinger Bands on the weekly basis.
 Dan Burgin
 U.Today Editorial Team