Disclaimer: The opinions expressed by our writers are their own and do not represent the views of U.Today. The financial and market information provided on U.Today is intended for informational purposes only. U.Today is not liable for any financial losses incurred while trading cryptocurrencies. Conduct your own research by contacting financial experts before making any investment decisions. We believe that all content is accurate as of the date of publication, but certain offers mentioned may no longer be available.
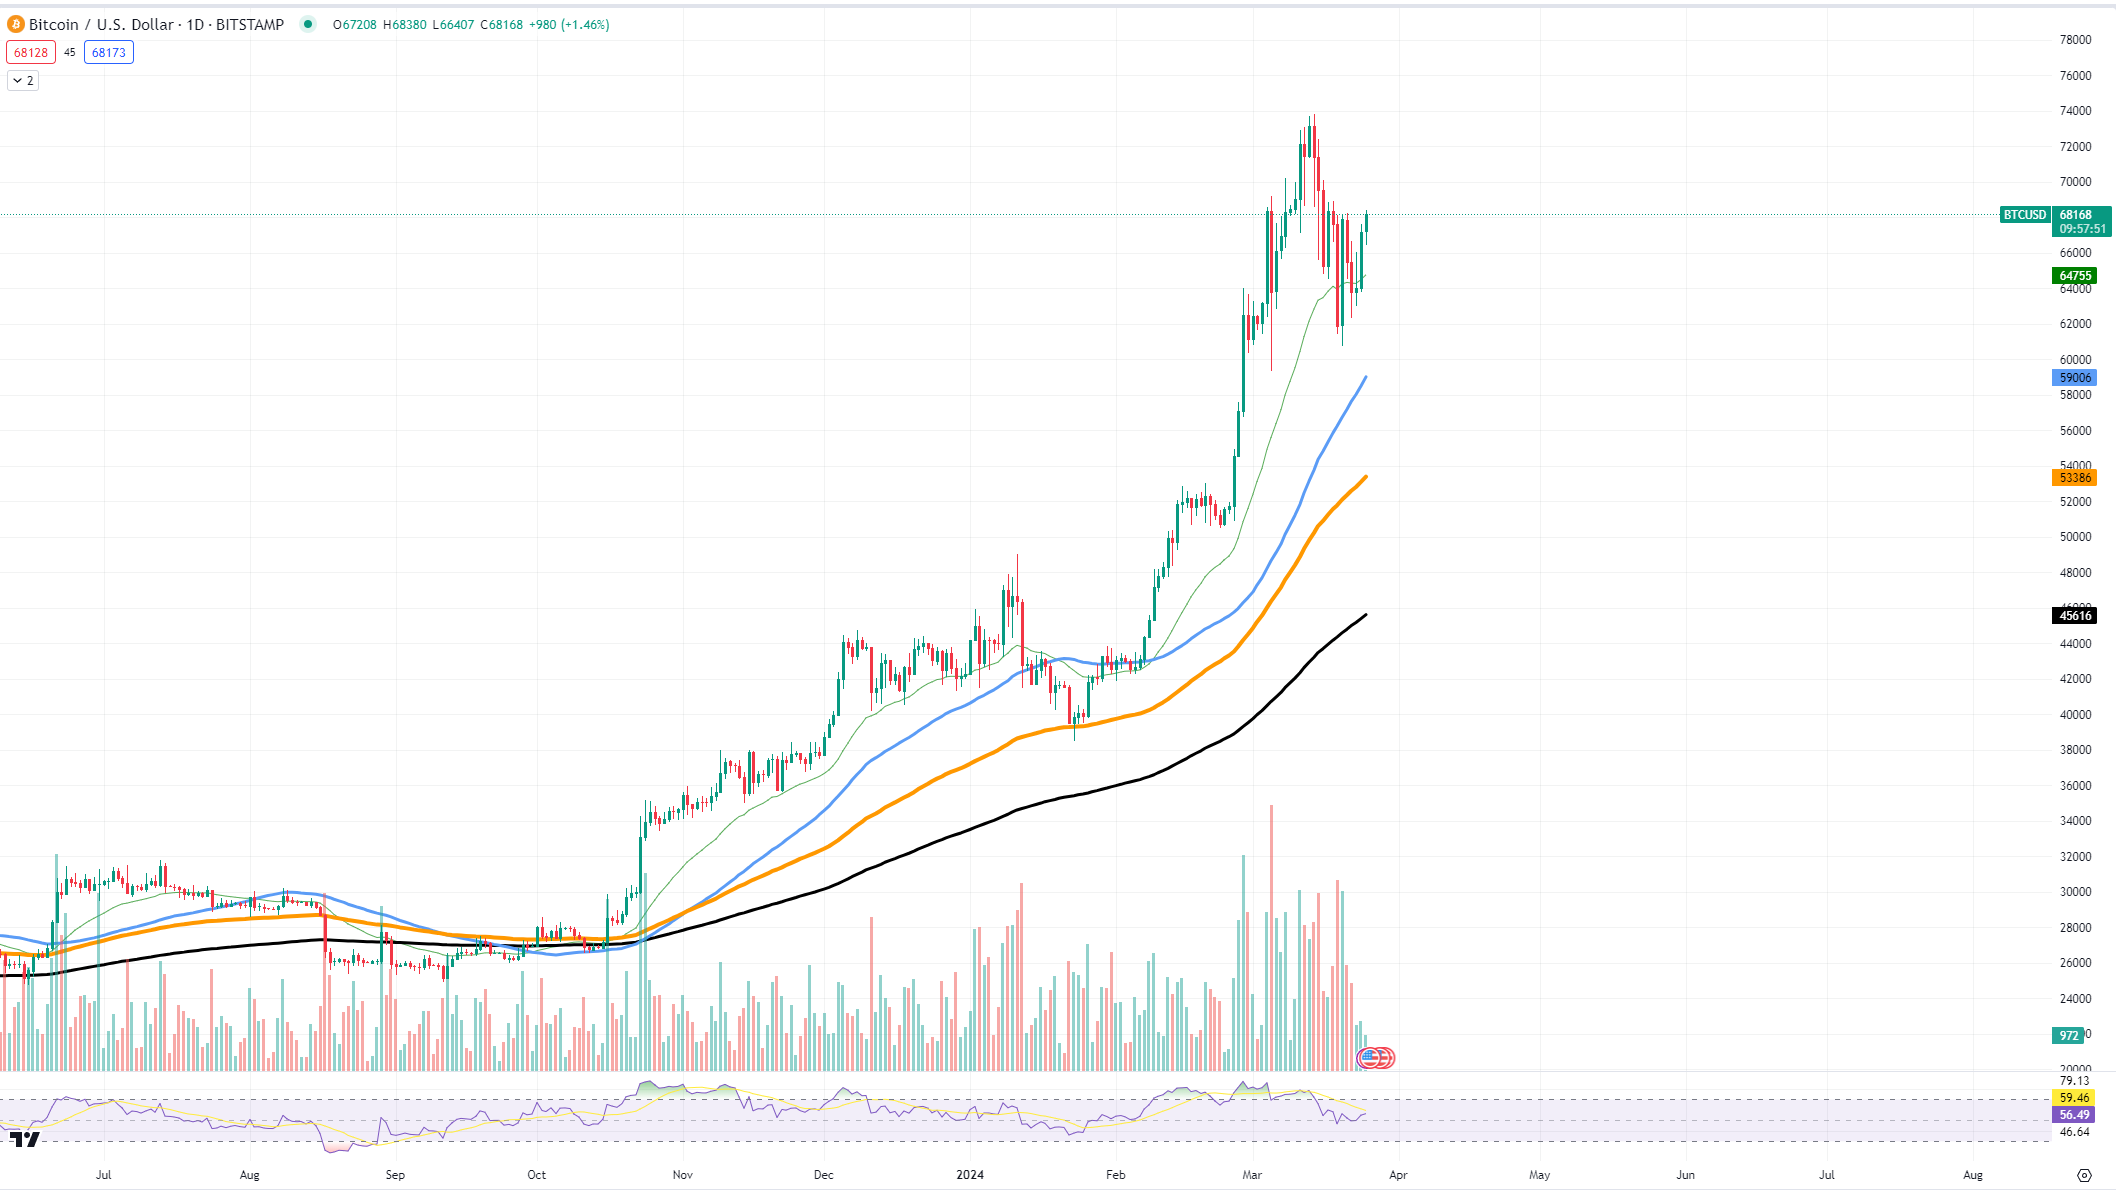
The market saw BTC take a dip a few weeks ago, but things are looking up again. By looking at the latest chart, we can see signs that Bitcoin might be on its way to reaching its all-time high (ATH) again.
The chart shows BTC's price making a U-turn after a dip. The current price hovers around $66,902, but just a while ago, it took a step back to about $53,324. This lower price is what we call a support level. The acceleration of the rally is what we are currently looking for.

On the other side, there is a price called "resistance." Think of it like a ceiling. Currently, that ceiling is near the highest price Bitcoin has ever reached, around $69,000. If Bitcoin can break through this ceiling, we could see it climbing to new highs.
Bitcoin has been gaining strength, moving above the orange line, which is the average price over the past 100 days. This is a positive sign. The big black line below, that is, the average over 200 days, shows that the overall trend has been going up. If buyers keep showing strong interest, and more people want to buy BTC than sell it, we could see the price make a push for that $69,000 ceiling.
Will Solana keep on moving?
Solana has been climbing up in value while the market was in correction. As expected, many people keep on looking at the chart and asking if the rally is going to stop in the foreseeable future.
Let’s dive into the numbers. Right now, Solana is at about $186.75. This is after a big jump from prices like $118.98, which was a strong "support" level. Support is like a floor, below which the price does not want to go. For Solana, the resistance is near $200. If the price breaks through this roof, it could go even higher, securing ATH potential.
Looking at the trend, Solana has been moving up faster since passing the average line, which is the blue one in the middle. This line is like a guide, showing the average price over 50 days. Above it is where Solana is now, showing that it has solid energy to move up.
For growth, if more people want to buy SOL than sell it, the price could push past $200 and move toward the next big resistance, maybe around $210 or more. But, remember, prices of cryptocurrencies like Solana may be like a roller coaster, with ups and downs.
As for the future, if Solana can keep above the 50-day line (the blue one), and especially if it goes over $200, it looks like the surge will not stop anytime soon.
Ethereum's promising picture
Lately, Ethereum has been drawing a triangle on the price chart. This is not just any shape; it is what traders call a "symmetrical triangle pattern." When we see this pattern, it usually means that a big price move could happen soon, but we cannot tell if it will go up or down.
Ethereum's price has been going up and down between two lines that are coming closer together. The top line is sloping down, and the bottom line is going up. Right now, Ethereum is around $3,442.7. The lines meet around the price of $3,000, which is a very important spot to watch.
If ETH breaks above the top line, the price could shoot up, possibly going higher than the recent high of about $3,575. This is the "resistance" level. But, if the price drops below the bottom line, it could go down to around $2,918 or even lower to $2,534, which are "support" levels.
So, what does this triangle tell us about what might happen with Ethereum's price? The triangle is getting tighter, and soon Ethereum will have to choose a direction. Unfortunately, we cannot tell whether it will be a move up or down.


 Alex Dovbnya
 Dan Burgin
 Denys Serhiichuk
 Gamza Khanzadaev