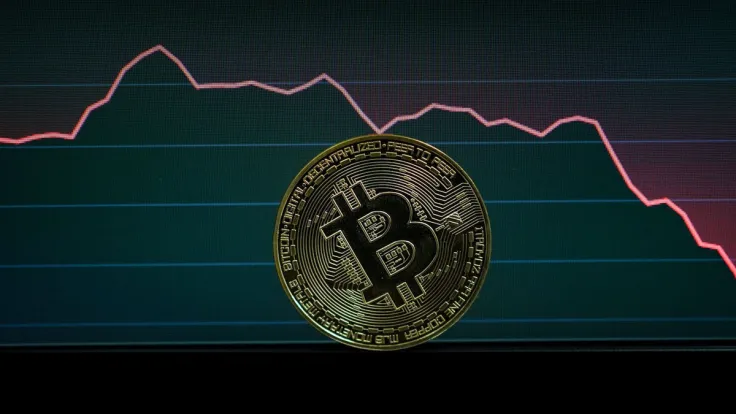
Seasoned analyst PlanB (@100trillionUSD), well known for his uber-bullish stock-to-flow models of the BTC price, explains why the orange coin is terribly oversold right now.
Bitcoin (BTC) monthly RSI at all-time low
Yesterday, Nov. 10, 2022, Plan B took to Twitter to share the dynamics of the Relative Strength Index (RSI) for the one-month timeframe. According to him, 1M RSI for the BTC/USD pair dropped to 40.5 in November.
#bitcoin has never been weaker. Monthly RSI 40.5 pic.twitter.com/TJ48VfwseB
— PlanB (@100trillionUSD) November 10, 2022
Developed by J. Welles Wilder Jr. in the 1970s, this indicator is used to demonstrate a trend in recent price changes of this or that asset. This, in turn, allows analysts to check whether the asset is overbought or oversold.
On the stock markets, the asset is considered to be oversold when RSI drops below 30. However, for such a large time frame, the 40.5/100 level is also very painful for bulls.
Bitcoin's 1M RSI has never been so low in the entire history of the first cryptocurrency.
As covered by U.Today previously, seasoned analyst Charles Edwards claimed that, according to his "Energy Value Model," Bitcoin (BTC) is also oversold and changes hands with more than a 50% discount.
Double bottom comfirmed?
Also, PlanB noticed that the recent Bitcoin (BTC) price collapse to $16,000 is the "second capitulation" that marks the bottom of this bear cycle. The first one was associated with the Luna/UST collapse in early May.
For him, this pattern looks exactly like that of the 2015 cycle with a double bottom associated with the hack of the Bitstamp exchange and the activation of Bitcoin's XT hardfork. Meanwhile, PlanB is not certain that Bitcoin's (BTC) bull run has started.
As covered by U.Today previously, Bitcoin's stock-to-flow model was broken in this cycle: per the model, BTC was predicted to spike to six-digit waters in 2022.

 Gamza Khanzadaev
 Tomiwabold Olajide
 Alex Dovbnya
 Arman Shirinyan