
Disclaimer: The opinions expressed by our writers are their own and do not represent the views of U.Today. The financial and market information provided on U.Today is intended for informational purposes only. U.Today is not liable for any financial losses incurred while trading cryptocurrencies. Conduct your own research by contacting financial experts before making any investment decisions. We believe that all content is accurate as of the date of publication, but certain offers mentioned may no longer be available.
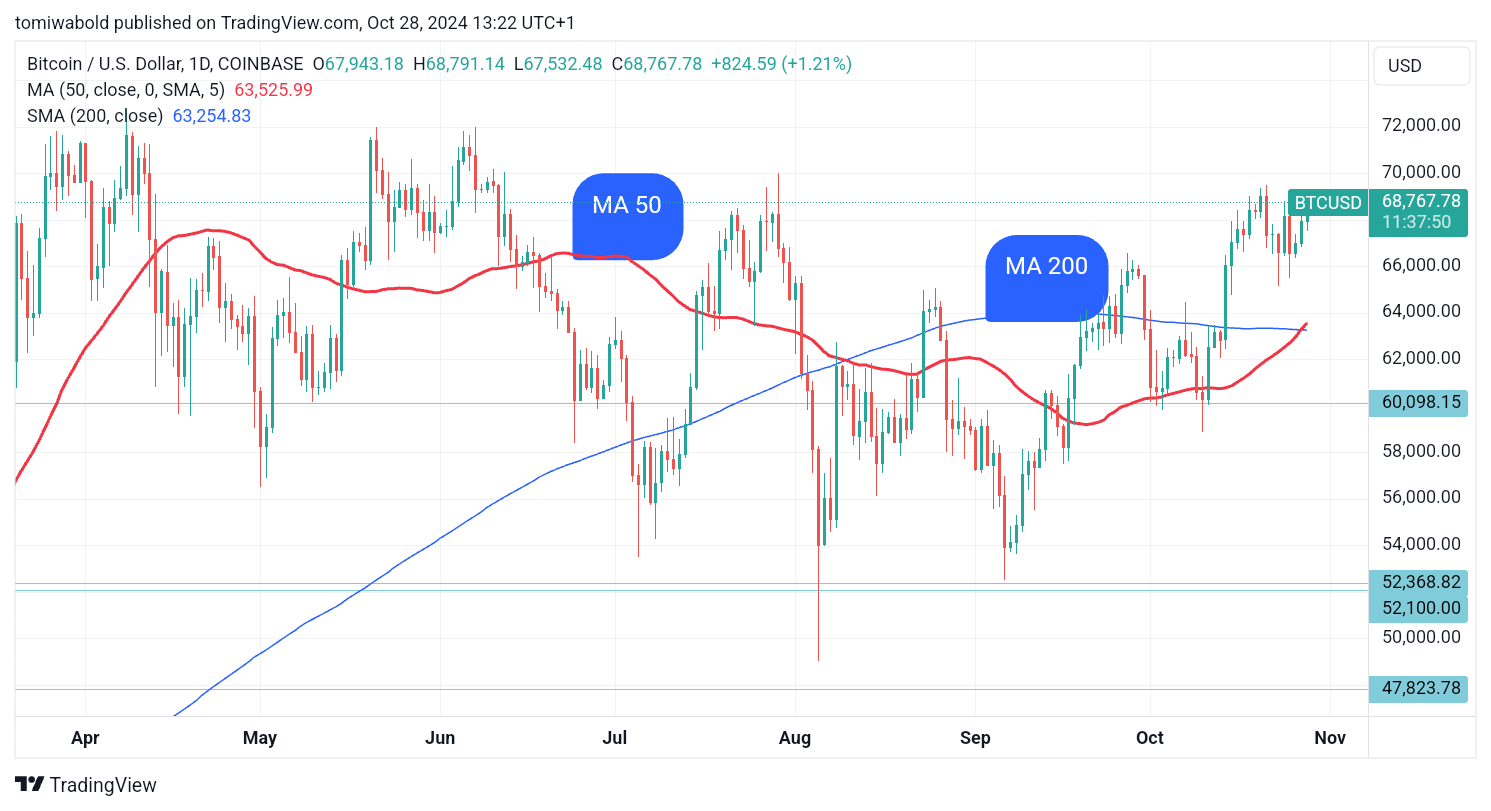
Bitcoin (BTC) recently formed a "golden cross," a technical chart pattern that historically signals the potential for further price gains. This pattern occurs when the 50-day moving average crosses above the 200-day moving average, indicating bullish momentum. In the case of Bitcoin, the 50-day SMA has crossed above the 200-day SMA, indicating a "golden cross."
Traders and analysts keep a close eye on this formation because, historically, it has preceded price rallies in Bitcoin and other assets. While the golden cross does not guarantee further gains at all times, it has been an encouraging sign in previous Bitcoin bull markets.
A trader who held BTC for a year between the first two golden crosses and the one in May 2020 would have earned triple-digit percentage profits. Following the golden cross in October 2023, Bitcoin's value doubled to new all-time highs of nearly $74,000 in mid-March.

However, moving average crossovers are sometimes criticized for being a lagging indicator that traps traders on the wrong side of the market. Bitcoin's most recent death cross, the opposite of a golden cross, trapped bears on the wrong side of the market, and the price of Bitcoin recovered above $66,000 barely a month later.
What comes next?
At the time of writing, BTC was up 2.37% in the last 24 hours to $68,610 having reached intraday highs of $68,758. Bitcoin began to rebound after finding support at a low of $65,500 on Oct. 25. Bulls have maintained the upward trend, and if Bitcoin closes in the green today, it would be the third straight day of gains.

Buyers will need to push the price above $69,550 to signal a resumption of the upward trend toward the top of the current range at $73,777. There is resistance at $70,000, but it may be crossed. In this scenario, Bitcoin might reach $72,000, but bulls are expected to confront stiff resistance from bears.
On the downside, a breakdown might give the bears the upper hand, with the BTC price closing below $65,000. If that happens, Bitcoin could fall below the 50-day simple moving average of $63,254 and then to the critical support of $60,000.
On the macroeconomic front, investors will continue to analyze a torrent of central bank commentary following last week's IMF meetings in Washington, D.C., with Federal Reserve policymakers currently under a blackout period that restricts them from commenting ahead of next week's interest rate decision.
 Dan Burgin
 U.Today Editorial Team