
Disclaimer: The opinions expressed by our writers are their own and do not represent the views of U.Today. The financial and market information provided on U.Today is intended for informational purposes only. U.Today is not liable for any financial losses incurred while trading cryptocurrencies. Conduct your own research by contacting financial experts before making any investment decisions. We believe that all content is accurate as of the date of publication, but certain offers mentioned may no longer be available.
Bitcoin might go through another impressive surge as the market sees an increase in an important technical indicator. Apart from that, there are few factors that might reinforce the value of digital gold.
We saw a significant market rotation yesterday: The Russell 2000 Index (IWM) increased by more than 3%, while the Nasdaq fell by more than 2%. A similar rotation signaled the start of a massive rally in Bitcoin and altcoins in November 2020, and this shift suggests a move toward riskier assets.
The total altcoin market cap increased 400% over the next four months after the IWM surge at that time. There are grounds for thinking that something like this could happen again. There are a number of indicators that suggest that the cryptocurrency market, including Bitcoin, may be trending positively.
It appears from recent data that Bitcoin miners who have been liquidating their holdings are starting to give in. It is possible that a price recovery will be facilitated by this easing of selling pressure and the downward momentum. Germany was the biggest Bitcoin seller in the last few days, and it seems like they are finally done with it.

The price trend of Bitcoin appears to be reversing, according to a number of mean reversion indicators. These indicators, which measure the price of Bitcoin's deviation from its historical mean, imply that the present undervaluation may eventually correct itself, resulting in higher prices.
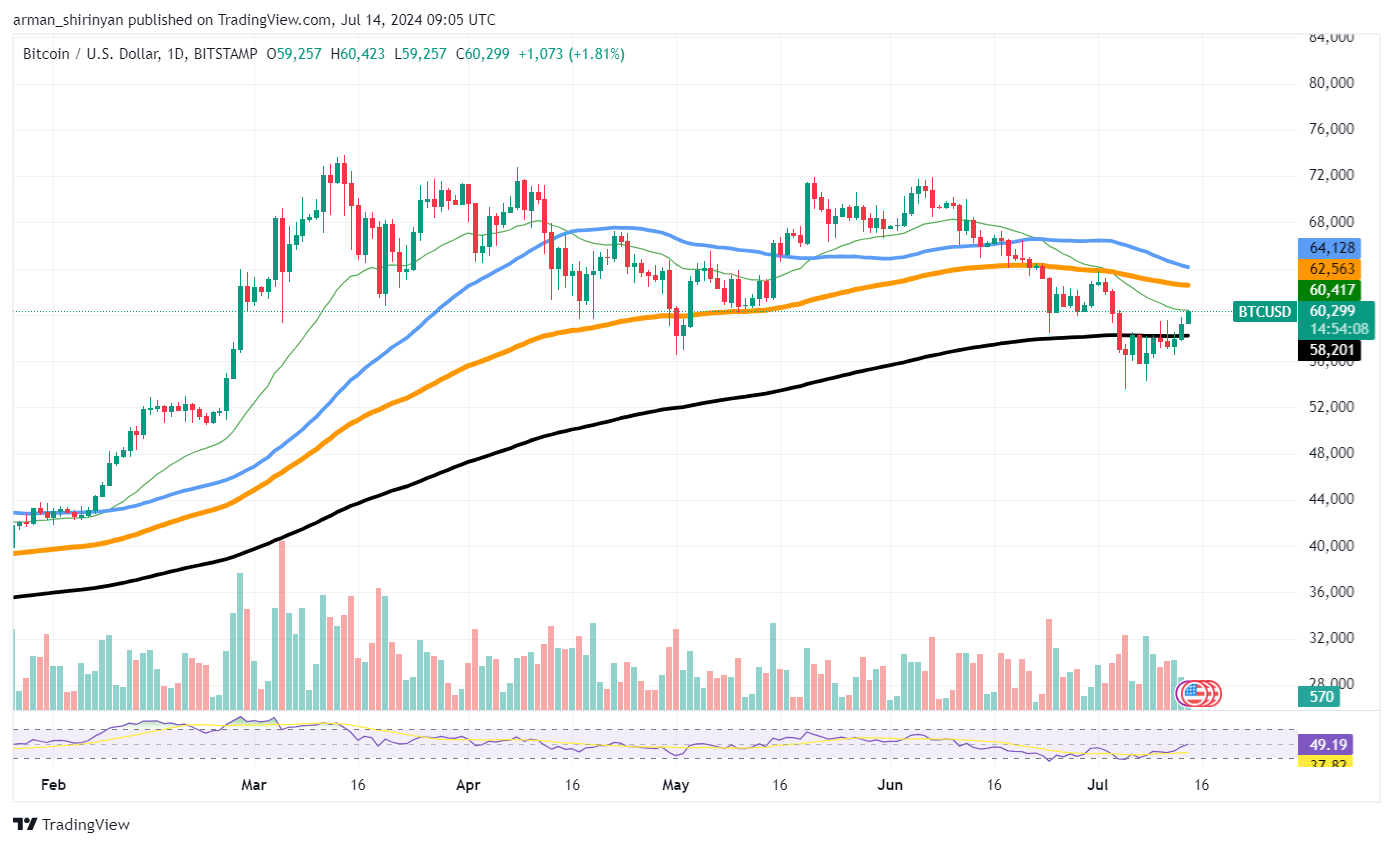
Additionally, encouraging signs can be seen in the technical on the Bitcoin price chart. After recently recovering from the 200 EMA support level at $58,201, the price of Bitcoin is currently trading at about $60,265. The next resistance levels to keep an eye on are the 50 EMA and 100 EMA. If these levels are broken above, it may validate a bullish trend and pave the way for yet another significant rally.
 Dan Burgin
 U.Today Editorial Team