
Disclaimer: The opinions expressed by our writers are their own and do not represent the views of U.Today. The financial and market information provided on U.Today is intended for informational purposes only. U.Today is not liable for any financial losses incurred while trading cryptocurrencies. Conduct your own research by contacting financial experts before making any investment decisions. We believe that all content is accurate as of the date of publication, but certain offers mentioned may no longer be available.
The recent market behavior of XRP, Ripple's native digital currency, has raised numerous questions. Key technical and on-chain metrics, typically indicators of future price movements, seem to clash with the current state of the coin, raising questions about its immediate direction.
A prime point of discussion has been the golden cross event that XRP recently underwent. In technical analysis, a golden cross is marked when a short-term moving average crosses above a long-term moving average, often the 50-day moving average surpassing the 200-day moving average.
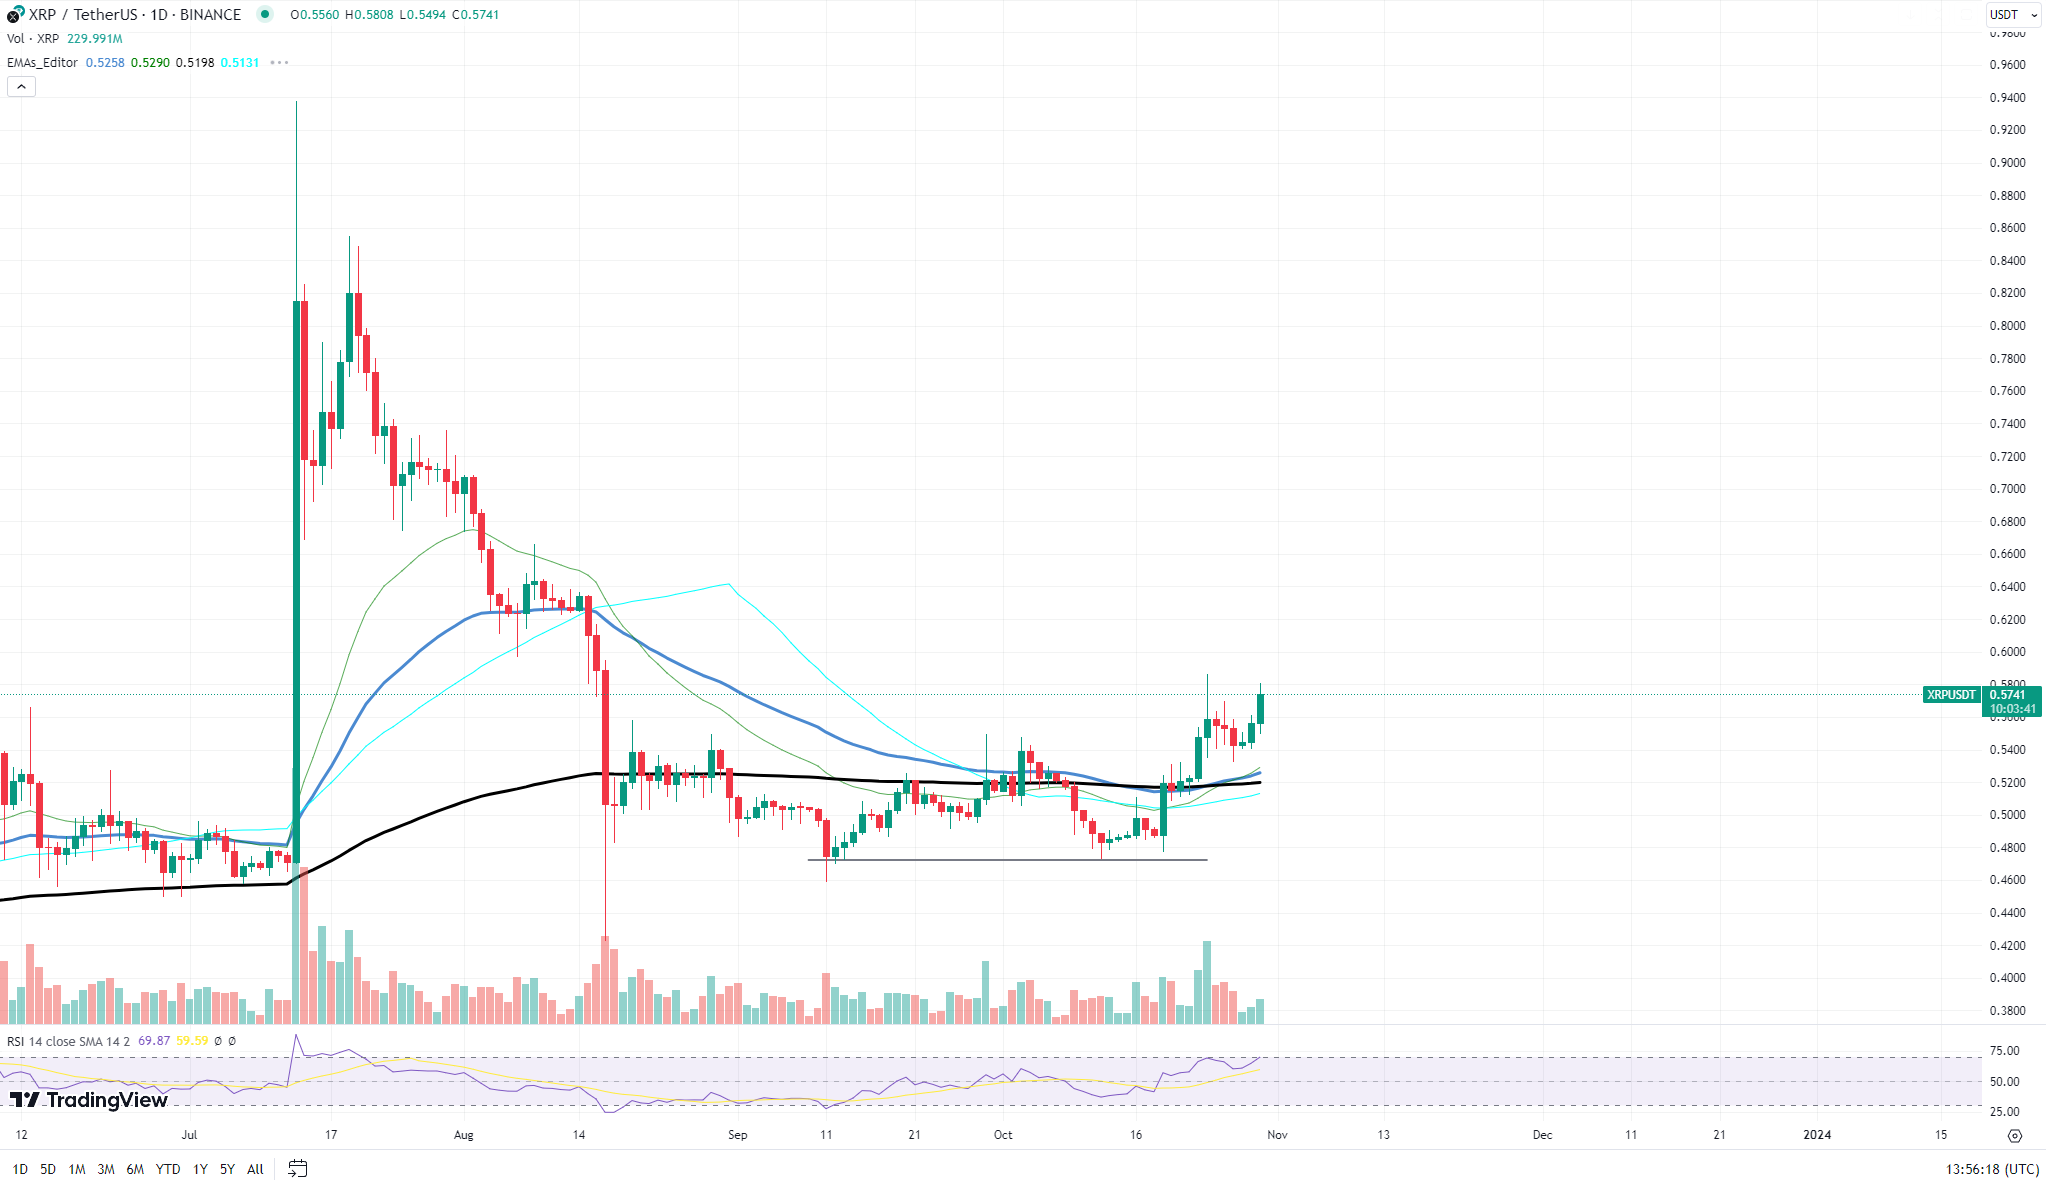
Historically, this is seen as a bullish sign, hinting at potential upside momentum. Given XRP's recent encounter with this event, many anticipated a positive price reaction. However, the asset has so far failed to realize this bullish potential, bringing about frustration among its holders.

While these metrics would usually indicate a bullish future for the asset, the lack of clarity in XRP's broader narrative is causing hesitation. The market is currently grappling with a multitude of factors, from global macroeconomic trends to regulatory pressures on cryptocurrencies. The ambiguity surrounding the asset's future, despite the positive on-chain metrics mentioned earlier, is leading to caution among investors and traders.
Ethereum's price rebounds
Ethereum, the second-largest cryptocurrency by market capitalization, has made a remarkable move, lunging toward the $1,900 mark. This price rebound, visible on the daily chart, comes as a surprise to many, especially when viewed in the context of the broader crypto market's ongoing correction phase. However, this rally is not without chinks in its armor. A detailed analysis of Ethereum's daily chart reveals certain weaknesses that should be of concern to investors and traders.

First, the sharp incline in price is not backed by a commensurate increase in trading volume. A price movement, whether upward or downward, is generally considered robust and sustainable when it is supported by high trading volume. In Ethereum's case, while the price has surged, the volume bars remain relatively low. This divergence can often signal a lack of strong conviction behind the move and raises concerns about its sustainability.
Additionally, the RSI (Relative Strength Index) at the bottom of the chart, although it is not in overbought territory, is approaching it rapidly. An RSI nearing or crossing the 70 mark can be an indicator of an asset being overbought, which might make it vulnerable to a sell-off.
From a purely price-based perspective, Ethereum faces immediate resistance near the $1,900 mark. Historically, this price level has acted as both support and resistance, making it a crucial point for Ethereum's short-term price trajectory. If Ethereum fails to break above this resistance, it might see a pullback. On the downside, support is observed around the $1,740 range, indicated by previous price actions where the asset found buyers.
Cardano moves forward
Cardano (ADA), hailed as one of the prominent cryptocurrencies in the decentralized finance realm, is currently showcasing an uptrend, as seen from the daily charts. Yet, a more in-depth dive into ADA's chart, particularly its alignment with the 200 Exponential Moving Average (EMA), reveals that the digital asset could be heading into a storm of resistance.
The 200 EMA is a renowned tool among traders, often used to determine the overall trend of an asset. When prices are above this line, it indicates a bullish market, and vice versa for bearish conditions. ADA's recent encounters with this EMA suggest that it may face significant resistance and potentially a trend reversal.
Additionally, the volume accompanying ADA's ascent does not seem to be as robust as one might expect. A rally is typically seen as sustainable when backed by substantial trading volume. The divergence between ADA's price movement and the relatively muted trading volume might be indicative of a weakening trend.
 Dan Burgin
 U.Today Editorial Team