Disclaimer: The opinions expressed by our writers are their own and do not represent the views of U.Today. The financial and market information provided on U.Today is intended for informational purposes only. U.Today is not liable for any financial losses incurred while trading cryptocurrencies. Conduct your own research by contacting financial experts before making any investment decisions. We believe that all content is accurate as of the date of publication, but certain offers mentioned may no longer be available.
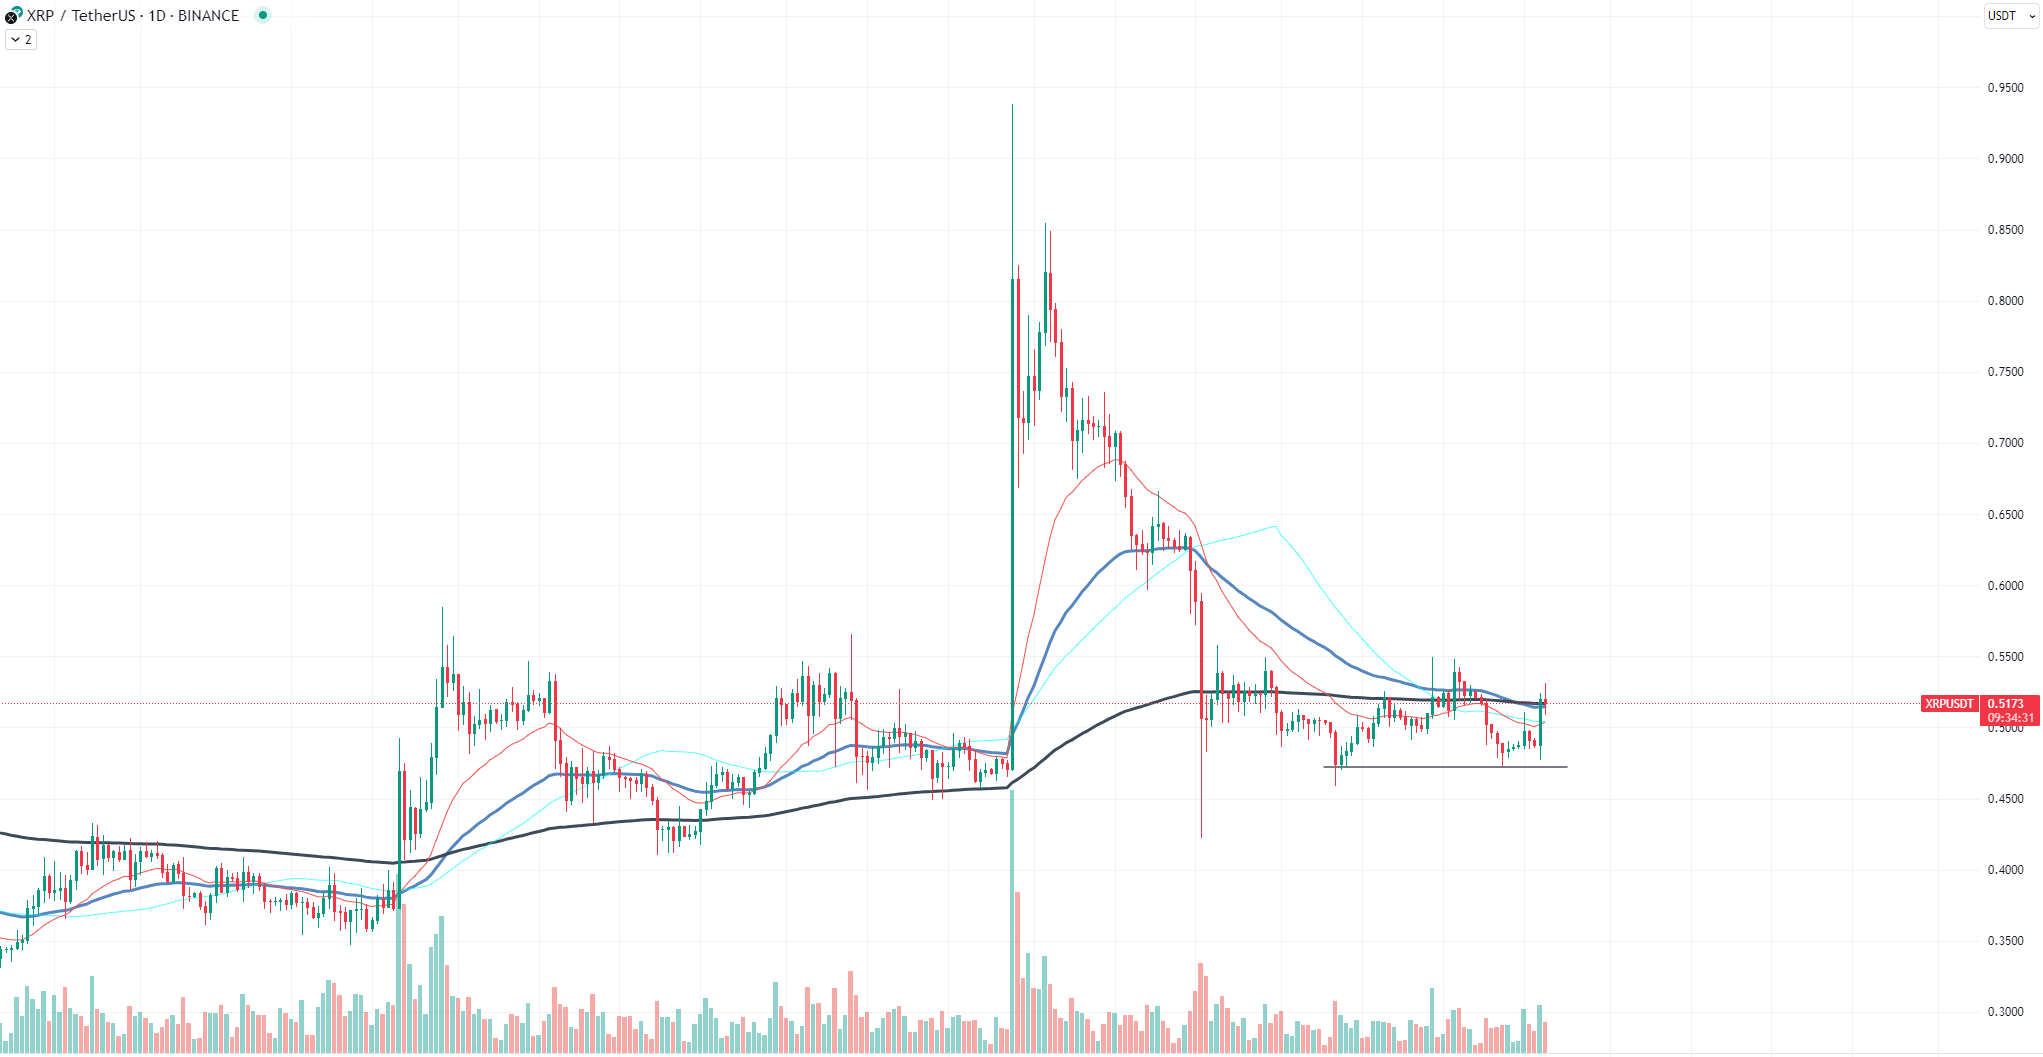
XRP was expected to experience a notable price surge following the favorable verdict in the legal case involving Ripple's top executives. However, the crypto market can often defy expectations, and this time was no different. Despite a significant win for Brad Garlinghouse and Chris Larsen against the Securities and Exchange Commission (SEC), XRP's anticipated bullish run turned out to be more of a whimper.
The chart showcases lackluster price performance for XRP on a daily basis. Prior to the decision, there was speculation on the market that a positive outcome would be the ignition XRP needed to once again reach its previous highs, if not exceed them. Investors and traders alike braced for a potential rally which, unfortunately, never materialized. The price remained stagnant, hovering around its current support levels with no significant upward movement.
Brad Garlinghouse, Ripple's CEO, had a passionate response to the court's decision. Celebrating Ripple's win against the SEC, he highlighted the challenges they faced during the case. His statement, "Today was an even better day. Ripple: 3 SEC: 0," displayed not just a tally of their victories but the sentiment that Ripple had been unjustly targeted. Garlinghouse accused the SEC of not just neglecting its duty to protect consumers and businesses but also of pursuing an aggressive, personal vendetta against him and Larsen.
Solana shows dominance
Based on a recent chart analysis of Solana (SOL), it is evident that the asset has made a significant move by breaking above a crucial resistance level. This type of price movement is often interpreted as a bullish signal, suggesting a potential further upside.
The daily chart illustrates a pattern in which SOL has faced numerous instances of resistance, making it challenging for the cryptocurrency to sustain any upward momentum. However, the latest breakout indicates a shift in market sentiment. There are several key observations to note:
Explosive growth: Over the past few weeks, Solana has exhibited a robust upward trend. Its recent breakout is preceded by a consolidation phase where the price action seemed to coil, often seen as a precursor to explosive moves. The sudden surge can be attributed to increasing investor interest and perhaps an anticipation of future positive developments within the Solana ecosystem.
Moving averages interplay: The interaction between the short-term and long-term moving averages indicates a potential golden cross scenario - a bullish sign. The short-term moving average is on track to cross above the long-term average, which often attracts more buyers into the market.
Volume analysis: An increase in trading volume accompanying the breakout emphasizes the strength behind the move. High volumes during such crucial breakouts signify a broader market agreement which, in turn, reduces the chances of false breakouts.
Drawing a parallel to the cryptocurrency giants, ETH's position in 2018-19 as a nonconsensus asset saw a transition to a consensus pick. Ethereum's journey from being a nonconsensus to a consensus asset established its dominance in the crypto landscape. SOL seems to be on a similar trajectory. As the saying goes, "ETH was non-consensus in 18/19, but is now consensus & anyone worth their salt as a crypto investor is there — quality asset."
Ether falls under BTC
The battle of the giants in the cryptocurrency world has always been a subject of immense scrutiny and debate. One of the most closely monitored metrics, the ETH/BTC price chart, serves as a testament to this ongoing competition. Lately, this ratio has painted a narrative where Ethereum's price performance has been significantly overshadowed by Bitcoin's dominant market stride.
A cursory glance at the ETH/BTC chart reveals a consistent downtrend, indicative of Ethereum's declining value against the might of Bitcoin. This trend is not just a mere reflection of the two cryptocurrencies' price dynamics but also offers deep insights into the broader altcoin market's volatility and liquidity.
Traditionally, the ETH/BTC ratio acts as a reliable volatility and liquidity metric for the altcoin sector of the cryptocurrency market. A rising ratio usually indicates an altcoin season, with Ethereum leading the charge and outperforming Bitcoin. Conversely, a declining ratio often suggests Bitcoin's supremacy, sidelining altcoins, including Ethereum.
Bitcoin's inherent qualities as a store of value, its increasing adoption by institutional investors and its finite supply might be driving its superior performance. On the other hand, Ethereum, while being a formidable platform for decentralized applications and smart contracts, still grapples with scalability issues and an ongoing transition to Ethereum 2.0.
 Dan Burgin
 U.Today Editorial Team