Compared to other altcoins experiencing overwhelming growth during this bullish period, Ripple hasn’t made any significant steps up. Traders are a bit disappointed, but it’s not all lost yet – that’s what TradingView users think. So, will Ripple take the course on new price targets, or it’s doomed? Read XRP price predictions – you’ll be surprised.
We hope for high profits and low risk

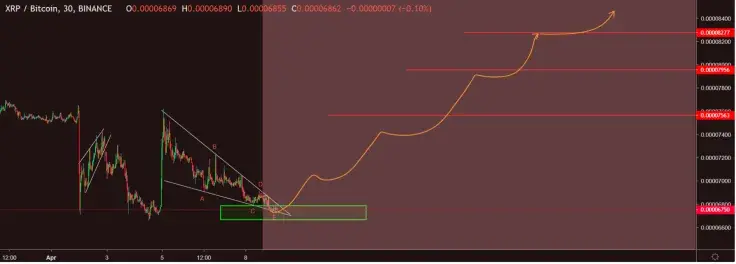
Ripple (XRP) price chart from Cryptosuf
At the moment, XRP looks very good. The TF pattern looks like a descending triangle which would break upwards if we can see it hit E. It can also break up earlier but to be safe, a purchase in the green zone will help. Right now, it’s the perfect time for trading, so don’t miss your chance!
XRP/BTC is ripe for a breakout

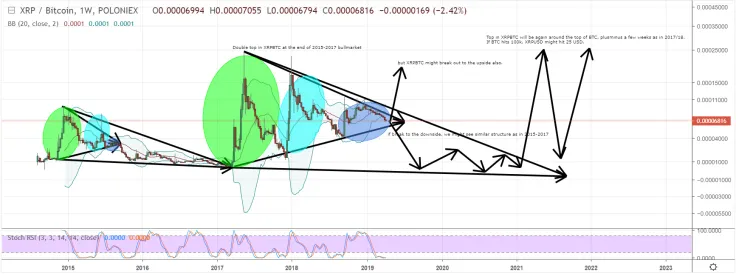
Ripple (XRP) price chart from FlaviusTodorius67
So far, XRP is the only altcoin that hasn't yet risen much since BTC made the last low and started rising now. XRP seems absolutely unimpressed and the price didn't change much.
Let’s look at XRP/BTC price chart to understand why.
XRP/BTC is interesting: 95% of the time it keeps just going down, and then suddenly, it pops around the Bitcoin top making an insane rise!
We could see something similar happen as the last time. There is a large triangle within a falling wedge structure in 2015-17.
Right now, a new big triangle has formed which will soon end. If XRP/BTC breaks to the downside, we might see something very similar happen as in 2015-17.
If it breaks sooner to the upside, the idea is invalidated. There’s a potential for a sooner break to the upside because stock RSI is massively oversold on weekly.
What about long-term perspectives? XRP/BTC can easily reach peak values again in the next 2-3 years. If BTC is at 100k in 2021, XRP/USD could go as high as $25-35.
According to FlaviusTodorius67, XRP has an interestingly high potential ROI (even x100 is possible).
A great opportunity to make some good gains

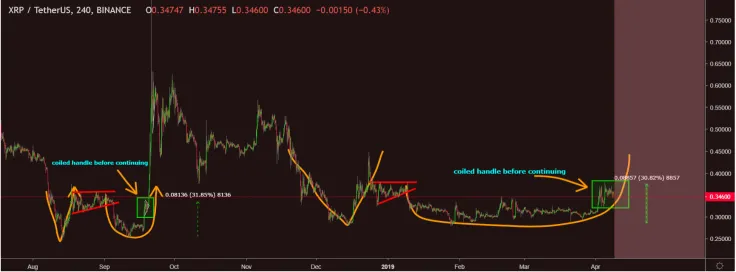
Ripple (XRP) price chart from Cryptosuf
Now we get down to the XRP/USDT chart. To get a better understanding of Ripple’s performance, let’s take a look at the fractal analysis performed by Cryptosuf. Both currencies had a handle after about 30-35% increases from the bottom of the rounded formation. Both have an ascending triangle looking in the middle (RED) between Adam and Eve.
That might seem strange, but Cryptosuf looks a great opportunity for gains in this fractal. It meets a lot of requirements. Thus, there’s still a chance for us to see Ripple crawling to $0.40 during this spring.
XPR to go up 60%?

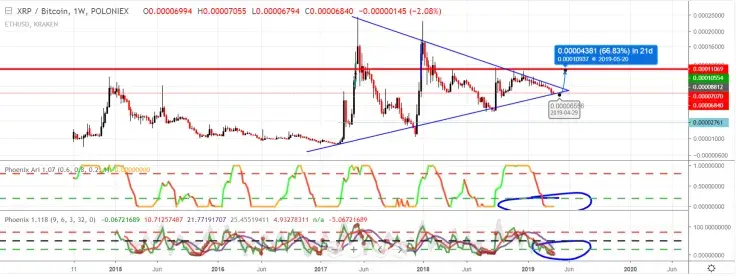
Ripple (XRP) price chart from JessicaWhite
User JessicaWhite analyzed XRP/BTC chart and found out there’s a chance for it to grow by 60% based on the triangle formation. According to her, XRP/BTC will grow to 0.00004381 in 21 days. Thus, it might be a good idea to invest now.
If you’re an advanced trader who prefers keeping assets in Bitcoins, you might increase your riches soon using Ripple as an instrument. Despite its slow growth in relation to the US Dollar, it might reach new heights on other markets.
XRP price charts are taken from TradingView
 Tomiwabold Olajide
 Caroline Amosun