
Disclaimer: The opinions expressed by our writers are their own and do not represent the views of U.Today. The financial and market information provided on U.Today is intended for informational purposes only. U.Today is not liable for any financial losses incurred while trading cryptocurrencies. Conduct your own research by contacting financial experts before making any investment decisions. We believe that all content is accurate as of the date of publication, but certain offers mentioned may no longer be available.
Despite the market drop that we have witnessed in the last few days, XRP's price performance was relatively stable despite the fact that the digital asset has reached the $0.46 price level, which is considered the multi-month bottom for the asset. But the key here is that XRP is forming a pattern somewhat similar to a double-bottom.
A bullish reversal pattern, known as the double-bottom pattern, frequently denotes a change in trend from one of decline to one of increase. It develops when the price of an asset reaches a low rise then declines again to a comparable low. Because of the W shape formed by the two low points, buyers are taking the initiative, and selling pressure is lessening.
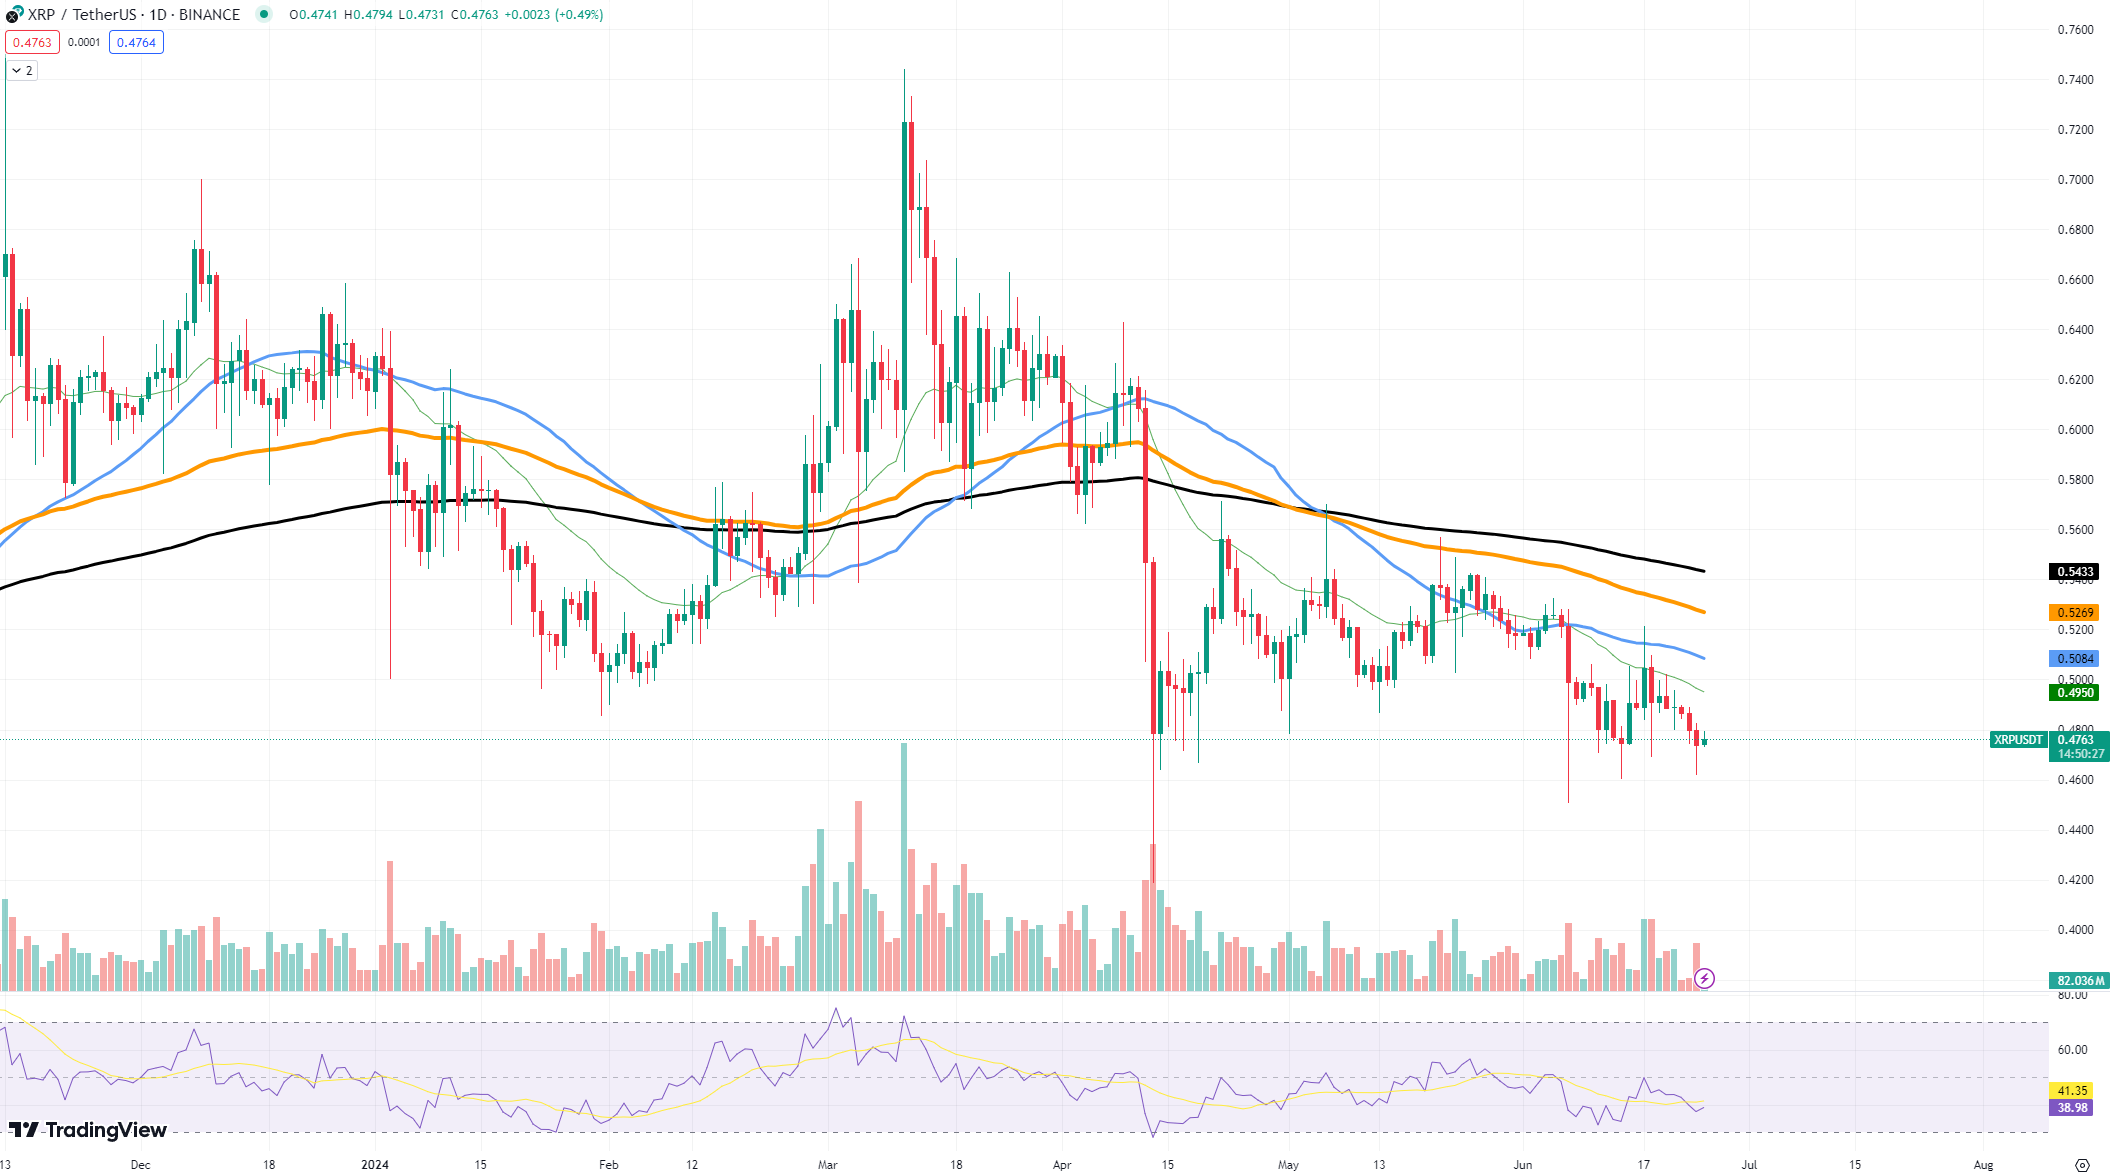
According to the chart, XRP has discovered strong support at the $0.46 mark. This support level has been put to the test several times, and XRP has succeeded each time. The fact that the market keeps testing and bouncing off the support level indicates that there are buyers who are stopping any further declines at this price.

A price reversal may appear if XRP maintains this support level and the double-bottom pattern plays out as expected. The $0.5 level is the initial target of this possible move. Based on a popular technique for estimating price targets in technical analysis, this target is determined by adding the pattern's height to the breakout point.
Additionally, there are indications of bullish divergence on the relative strength index, which suggests that the downward momentum is waning. This might be a reliable indicator of a possible price reversal when combined with the double-bottom pattern.
However, it is important to remember that technical patterns are not foolproof; they can offer some insights, but they may not be the go-to scenario for any asset. Price changes can be greatly influenced by the overall state of the market.
 Dan Burgin
 U.Today Editorial Team