
Disclaimer: The opinions expressed by our writers are their own and do not represent the views of U.Today. The financial and market information provided on U.Today is intended for informational purposes only. U.Today is not liable for any financial losses incurred while trading cryptocurrencies. Conduct your own research by contacting financial experts before making any investment decisions. We believe that all content is accurate as of the date of publication, but certain offers mentioned may no longer be available.
The XRP market recently witnessed movement that would dishearten many bullish investors: a classic "bull trap." After breaking through the local trendline resistance, the price on the XRP/USDT chart showed a misleading bullish signal, causing a stir among traders expecting a sustainable upward trend.
A bull trap occurs when a declining price breaks above a significant resistance level, suggesting the start of an upward trend. However, instead of continuing to rise, the price fails to sustain the breakout and falls back below the resistance level. This false signal lures bullish traders into buying under the assumption that the market is reversing in favor.
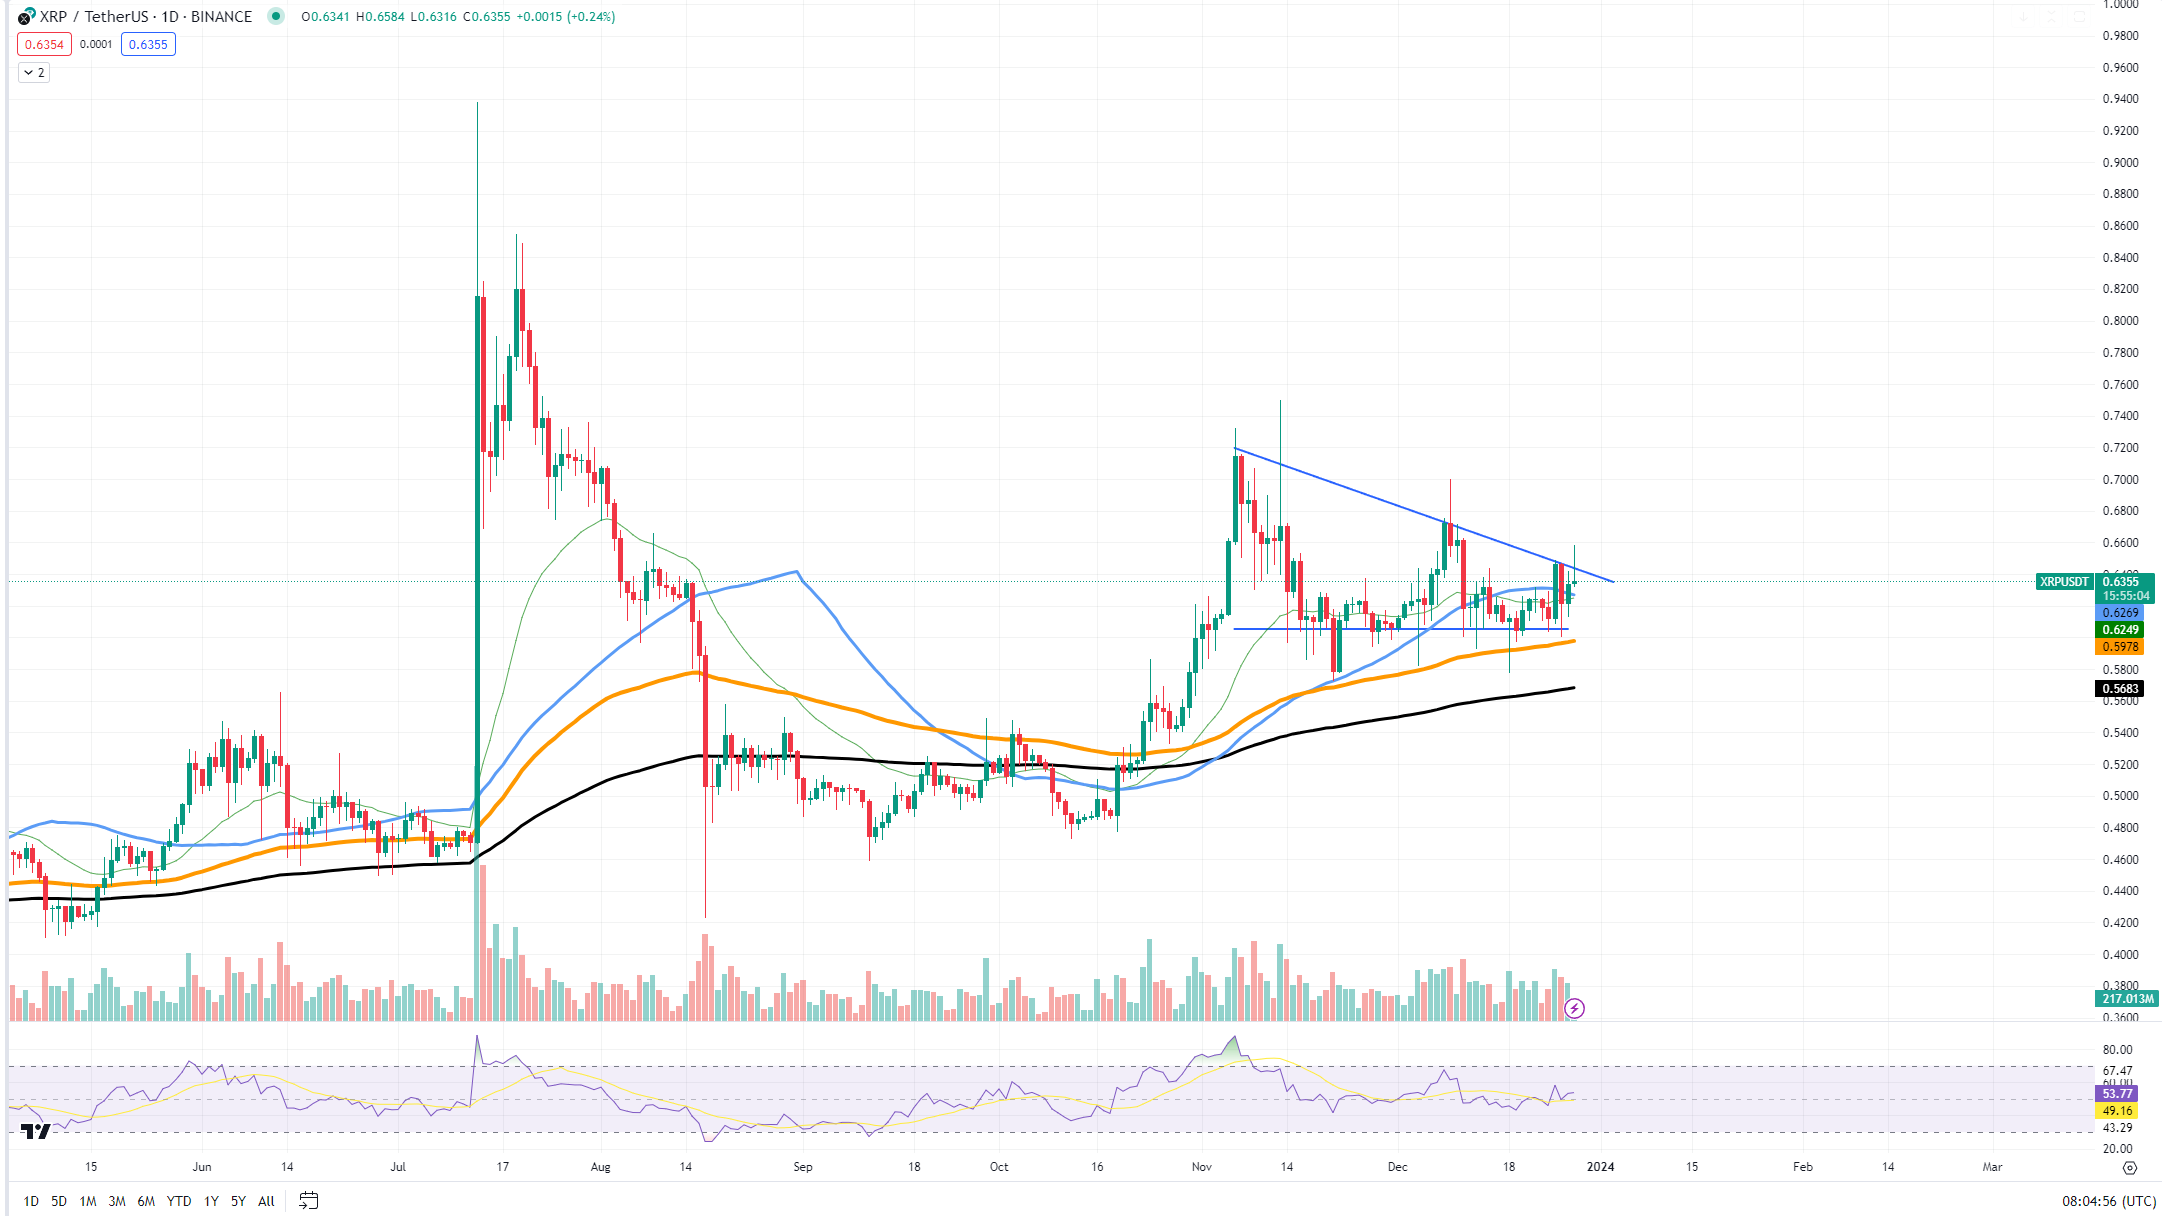
The implications of a bull trap are typically negative for the asset's short-term price performance. Traders who bought in during the false breakout are often left to sell at a loss as the market readjusts and the price declines. This selling pressure can exacerbate the downward movement, leading to a steeper price correction.
In the case of XRP, the price's reluctance to hold above the trendline may have been perceived as a bullish signal but quickly turned into a classic bull trap scenario. This event could lead to a shift in market sentiment from bullish to bearish, as the failed breakout dampens investor confidence and may trigger a conservative approach from traders.

Additionally, while the Relative Strength Index (RSI) is above 50, indicating generally bullish momentum, it is not sufficient to counteract the bearish implications of the bull trap. The RSI being above 50 suggests that there might be some bullish sentiment on the market. However, in the context of a bull trap, this could also mean that the market is overbought, and a correction is due.
The presence of a bull trap and an RSI above 50 on XRP's chart could be indicative of a market that is not as strong as it seems. Traders might be cautious in the near term, watching for the price to establish a new level of support before considering reentry.
 Dan Burgin
 U.Today Editorial Team