Disclaimer: The opinions expressed by our writers are their own and do not represent the views of U.Today. The financial and market information provided on U.Today is intended for informational purposes only. U.Today is not liable for any financial losses incurred while trading cryptocurrencies. Conduct your own research by contacting financial experts before making any investment decisions. We believe that all content is accurate as of the date of publication, but certain offers mentioned may no longer be available.
According to a recent Santiment insights article, XRP is one of the better looking NVT charts in the entire crypto market, considering the increase in network circulation in May, with a further correction in June. Even more, the NVT chart may form a divergence for XRP, which would be a bullish factor for XRP by the end of this summer.
What's NVT, and why does it matter?
The NVT is a digital assets industry alternative to PE ratio, which evaluates asset value by market capitalization divided by transaction volume. If the value is too high, the network is considered overvalued compared to the low transaction volume.

To simplify: whenever NVT values are high, the asset is considered bearish, as the worth of the network is overvalued and a coin or token is considered bullish if the market cap is undervalued compared to the high transaction volume.
XRP's case
As the NVT suggests, XRP is currently bullish, as the price of the asset took a huge hit, dropping to multi-week lows at $0.33, which makes the market capitalization of the asset significantly lower despite the remaining transactional activity.
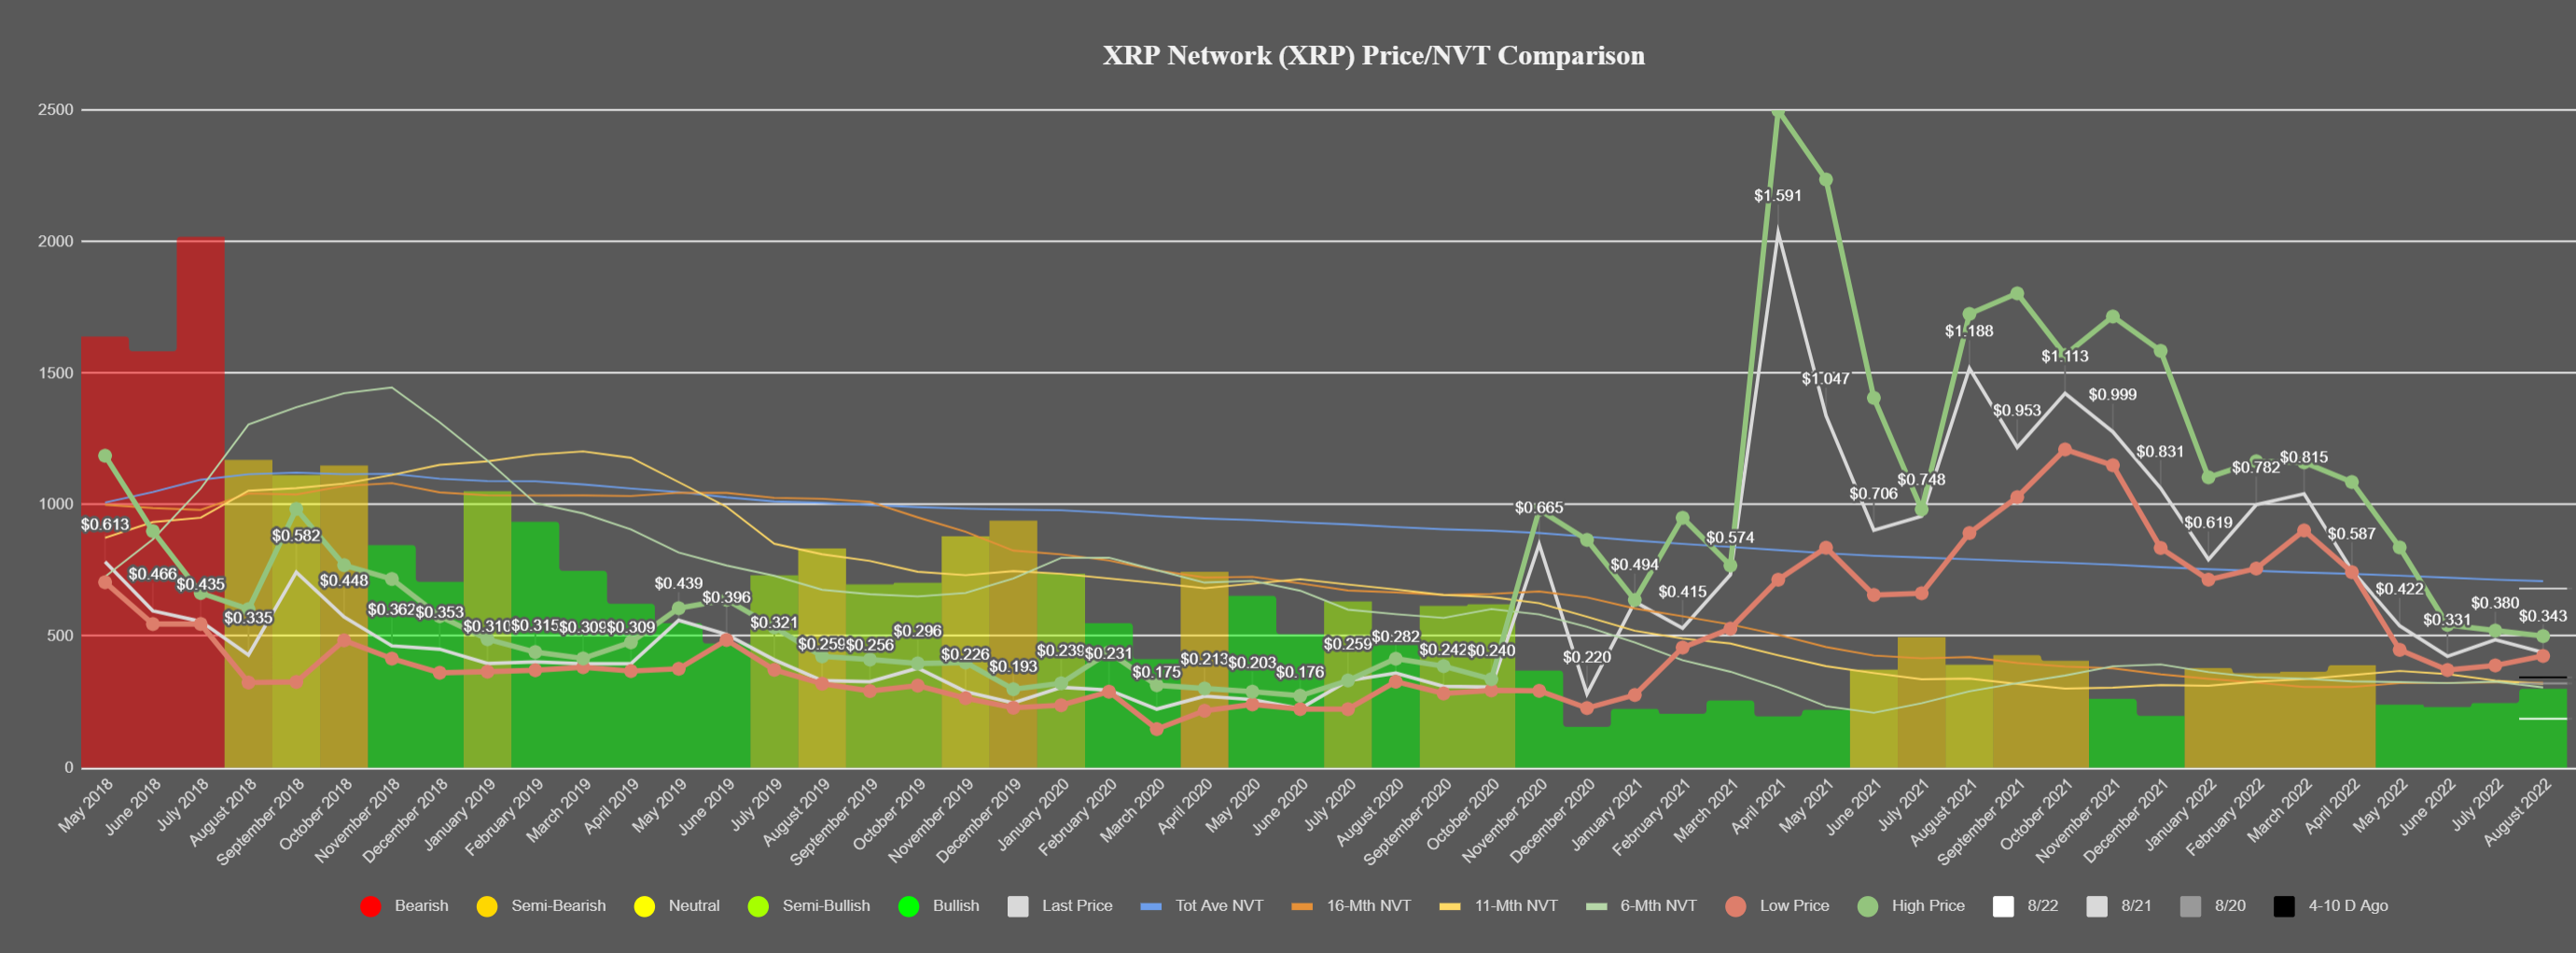
With the high activity of XRP users and a low market capitalization, a divergence occurs that hints at a possible reversal that might happen once the correction on the market is over.
NVT is one of many indicators that were hinting at the retrace of XRP as the Relative Strength Index shows that the asset is oversold on certain timeframes. This suggests the imminent fading of the bearish rally.
At press time, XRP is changing hands at $0.33 and losing 1.4% of its value in the last 24 hours.
 Dan Burgin
 U.Today Editorial Team