Disclaimer: The opinions expressed by our writers are their own and do not represent the views of U.Today. The financial and market information provided on U.Today is intended for informational purposes only. U.Today is not liable for any financial losses incurred while trading cryptocurrencies. Conduct your own research by contacting financial experts before making any investment decisions. We believe that all content is accurate as of the date of publication, but certain offers mentioned may no longer be available.
XRP has recently caught the attention of traders and analysts alike with its impressive 20% surge. However, a deeper dive into the asset's technical indicators suggests that this rally may be treading on thin ice.
One of the most telling signs of potential trouble is the Relative Strength Index (RSI). The RSI is a momentum oscillator that measures the speed and change of price movements. Traditionally, an RSI reading above 70 is considered to be in "overbought" territory, indicating that the asset might be overvalued and could be due for a price correction. As of recent data, XRP's RSI has entered the oversold zone, signaling that the cryptocurrency might be overextended and could face downward pressure.
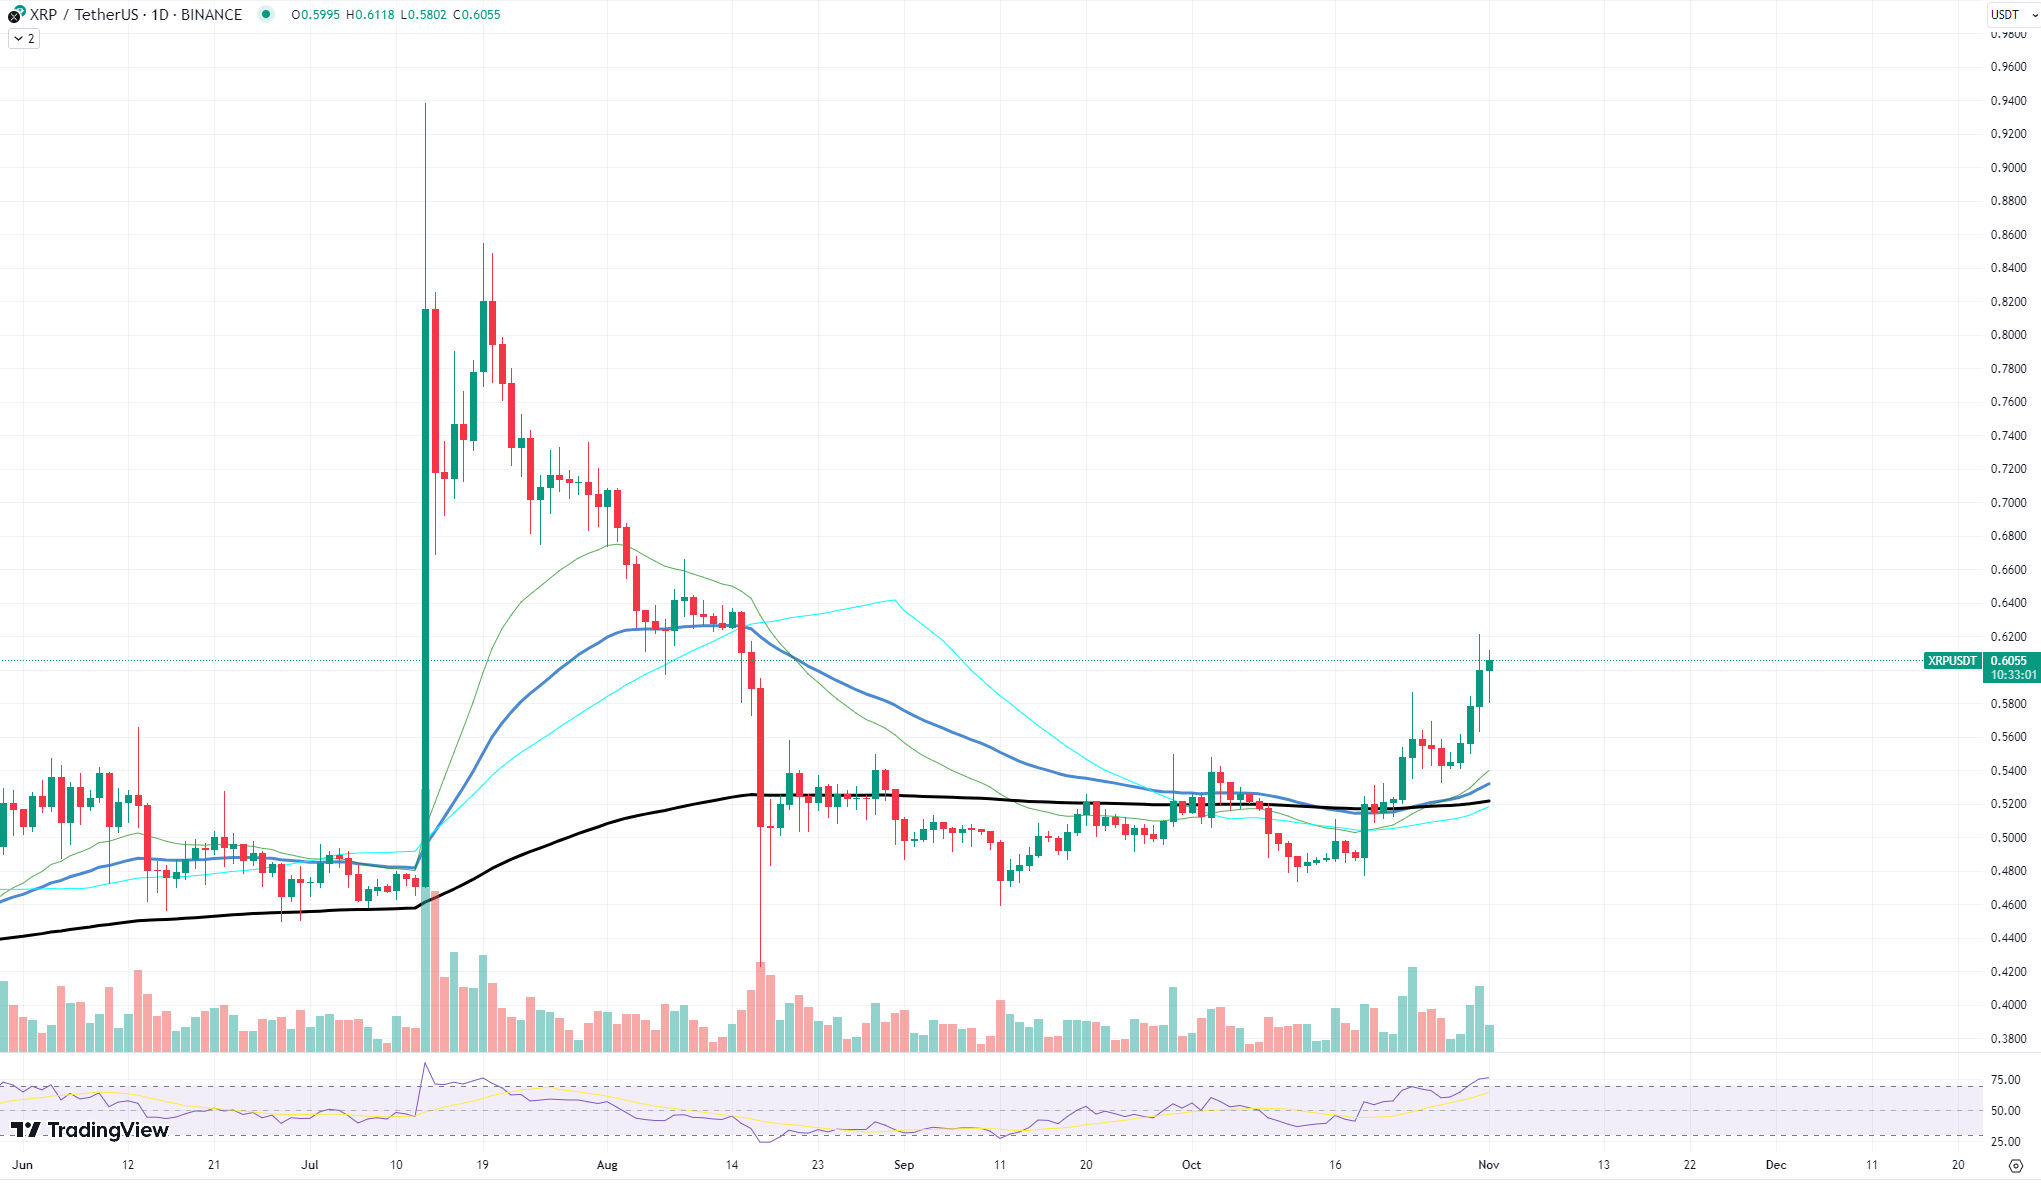
In addition to the RSI, another worrying sign is the descending volume. Even as the price of XRP surged, the trading volume has been on a decline. This divergence between rising prices and falling volumes is often considered a bearish signal in technical analysis. A rally backed by decreasing volume might indicate a lack of strong conviction among traders, and such rallies are often unsustainable in the longer term.
Lastly, the resistance level at $0.63 presents a significant hurdle for XRP. In technical analysis, resistance levels signify a point where selling interest surpasses buying pressure, preventing the price from rising any further. XRP's recent surge has brought it close to this resistance level, and a failure to break above could lead to a potential pullback.
Shiba Inu on crucial level
Shiba Inu (SHIB) has garnered significant attention in recent times, riding waves of volatility inherent to the cryptocurrency market. A recent analysis of its price movements, however, suggests that SHIB is facing a defining moment that could chart its path for the near future.
A notable development is the coin's interaction with the 200-day Exponential Moving Average (EMA), a key technical indicator used by traders to gauge long-term price trends. Historically, the 200 EMA has acted as a pivotal support or resistance level for many assets.

Considering the current chart setup, there are two possible scenarios for SHIB's future price movements:
Bounce back from support: If SHIB manages to find strong buying interest at the current support level, we might witness a bounce back. This would entail the coin making another attempt to break above the 200 EMA and possibly reigniting the uptrend. A sustained move above this level could attract fresh buying, potentially leading to a new rally.
Continued downtrend: On the flip side, if SHIB fails to hold onto the current support and breaks below it, it could signal a continuation of the bearish sentiment. In this scenario, the coin might test lower support levels, and the selling pressure could intensify, leading to a deeper correction.
Dogecoin at crossroads
Dogecoin (DOGE) recently experienced a significant trend reversal. A vital technical observation has been the coin's fall below the 200-day Exponential Moving Average (EMA), a commonly used metric to determine an asset's long-term trend.
Historically, the 200 EMA has acted as a reliable indicator for both support and resistance levels. The recent movement of Dogecoin below this key indicator can be seen as a bearish signal, suggesting that the previous upward momentum may be stalling.
Given the coin's current trajectory, two potential scenarios emerge:
Recovery above the 200 EMA: If Dogecoin manages to rally and break above the 200 EMA, it would imply a bullish resurgence. This scenario would necessitate significant buying pressure to push the coin above the crucial EMA, signifying renewed confidence in DOGE.
Extended downtrend: Conversely, if Dogecoin continues to trade below the 200 EMA without showing signs of recovery, it could indicate an extended bearish phase. In this scenario, the coin may seek out new support levels lower than its current trading range. Investors should be wary of intensified selling pressure, which could further pull the coin's price down.
 Dan Burgin
 U.Today Editorial Team