
Disclaimer: The opinions expressed by our writers are their own and do not represent the views of U.Today. The financial and market information provided on U.Today is intended for informational purposes only. U.Today is not liable for any financial losses incurred while trading cryptocurrencies. Conduct your own research by contacting financial experts before making any investment decisions. We believe that all content is accurate as of the date of publication, but certain offers mentioned may no longer be available.
As it has been doing for the past few months, the price channel that Bitcoin is trading inside is descending. When Bitcoin gets closer to the upper limit of this channel, which is around $70,000, the chance of another attempt to break through this level increases, but so does the chance of a drawback.
The price action of Bitcoin has recently bounced off lower levels indicating strength according to the chart analysis but it is still stuck in this declining channel. Bitcoin will require a strong catalyst or considerable buying momentum to break above the upper trendline and launch a significant advance toward $70,000.
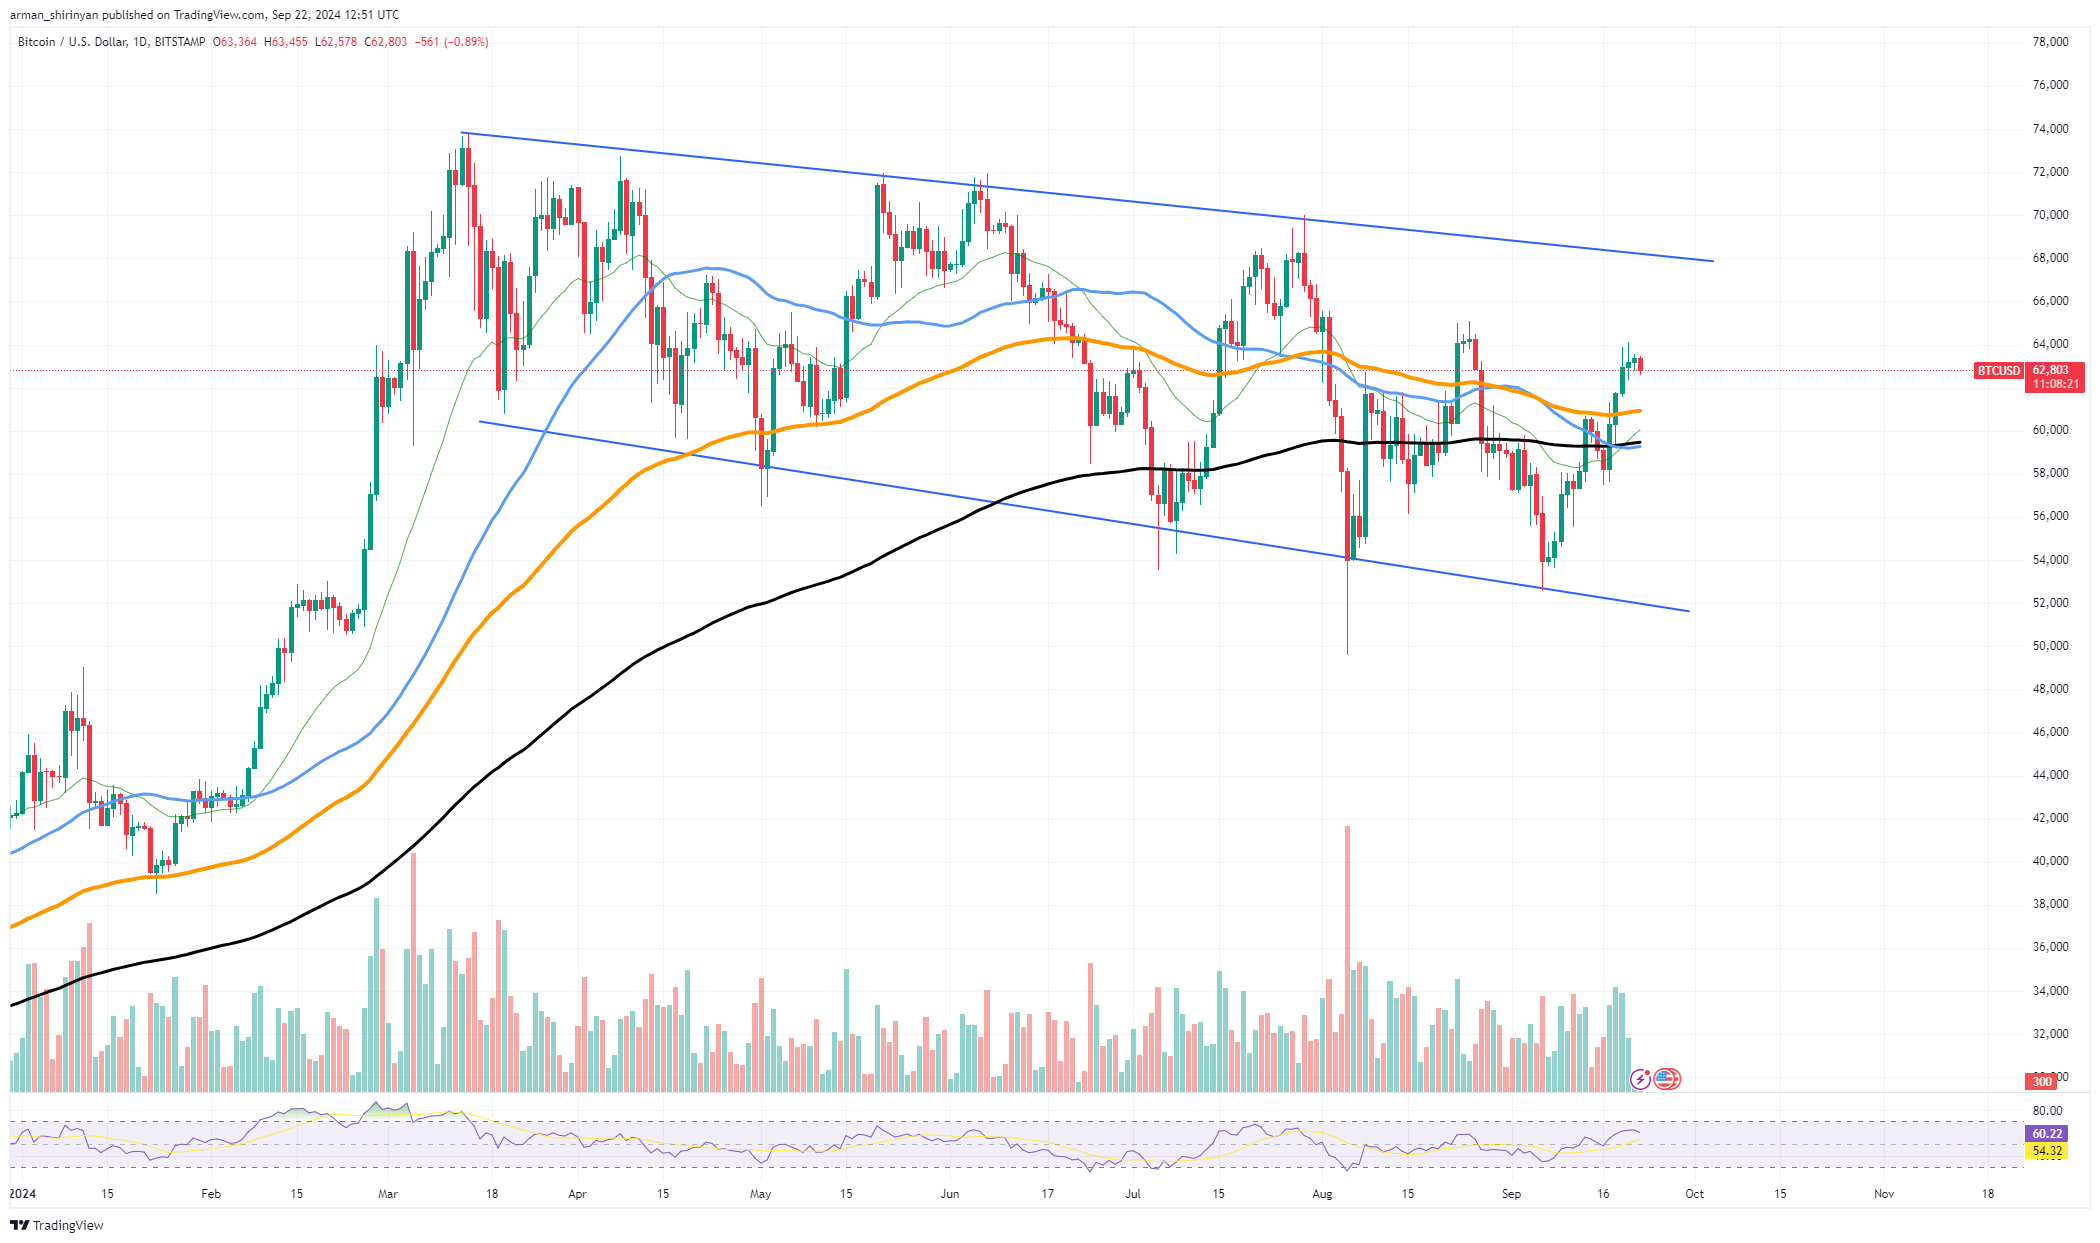
New heights could be reached if it succeeds in testing $70,000 once more. We might witness a retreat back to important support levels though if BTC is unable to sustain this increasing pressure.
In case of a retracement, the psychological level of $60,000 should be looked after as it is also the current resting place of the 100-day moving average. The 200-day EMA and earlier consolidation zones as well as $58,000 provide further support below that.
In a bull market the $75,000 level would be the next target if Bitcoin crosses the $70,000 threshold. Bitcoin may face difficulties in this area once more as it has previously shown to be a strong area of resistance in previous market cycles.
XRP's pattern plays out
A symmetrical triangle pattern on XRP just saw a notable breakthrough suggesting that there may be more upside momentum ahead. Since August this triangle had been developing suggesting that XRP was gathering strength and preparing for a move. Furthermore it is evident that the market is moving toward a bullish sentiment now that the breakout has occurred.
These patterns frequently precede sharp moves in either direction which makes the breakout from this symmetrical triangle noteworthy. Given that XRP was able to break higher this indicates that the bulls are currently in the driver's seat. Still it is unclear if this momentum will continue or if there may be an invalidation.

Although XRP appears to be in good shape right now, invalidation is still a possibility. The breakout may have been a fake move if the price dropped back into the triangle and broke below important support levels.
XRP must maintain above the $0.58 support zone which has been a significant area of interest to confirm a sustained bullish trend. A rapid retreat back to the lower $0. 55 region could result from a failure to hold this level. On the plus side if XRP keeps rising and stays above resistance it could see additional gains. In an attempt to build on the recent breakout the market may set its sights on the $0. 65–$0. 70 region as its next target.
Ethereum makes return
After a brief period of bullish momentum Ethereum has returned to its descending price channel however the overall trend appears to be waning. The second-largest cryptocurrency by market cap is exhibiting indications of a possible reversal despite its recent upward trend.
Since the middle of 2023 ETH's price has been moving lower due to a persistent bearish trend that the cryptocurrency has struggled to overcome. Ethereum has recovered quite well over the last week as seen by the current chart rising back above the $2,500 threshold. But the bullish dynamic seems to be waning as the price approaches significant resistance levels around $2,600 and $2,700.

The price is currently consolidating within this declining channel and there is a discernible lack of strong momentum. Whether Ethereum can hold this level or if there will be a reversal back toward $2,400 or even $2,300 is the crucial thing to keep an eye on.
A return to bearish sentiment and additional downward movement in the upcoming weeks could be indicated if it breaks below these crucial support levels. But there is some good news for holders of ETH. Ethereum may still be able to gain more traction in the next trading sessions especially on Monday when markets usually see a surge in activity. The $2800 region may be retested by ETH if buying interest increases and the price can break above its present resistance.
 Dan Burgin
 U.Today Editorial Team