
Disclaimer: The opinions expressed by our writers are their own and do not represent the views of U.Today. The financial and market information provided on U.Today is intended for informational purposes only. U.Today is not liable for any financial losses incurred while trading cryptocurrencies. Conduct your own research by contacting financial experts before making any investment decisions. We believe that all content is accurate as of the date of publication, but certain offers mentioned may no longer be available.
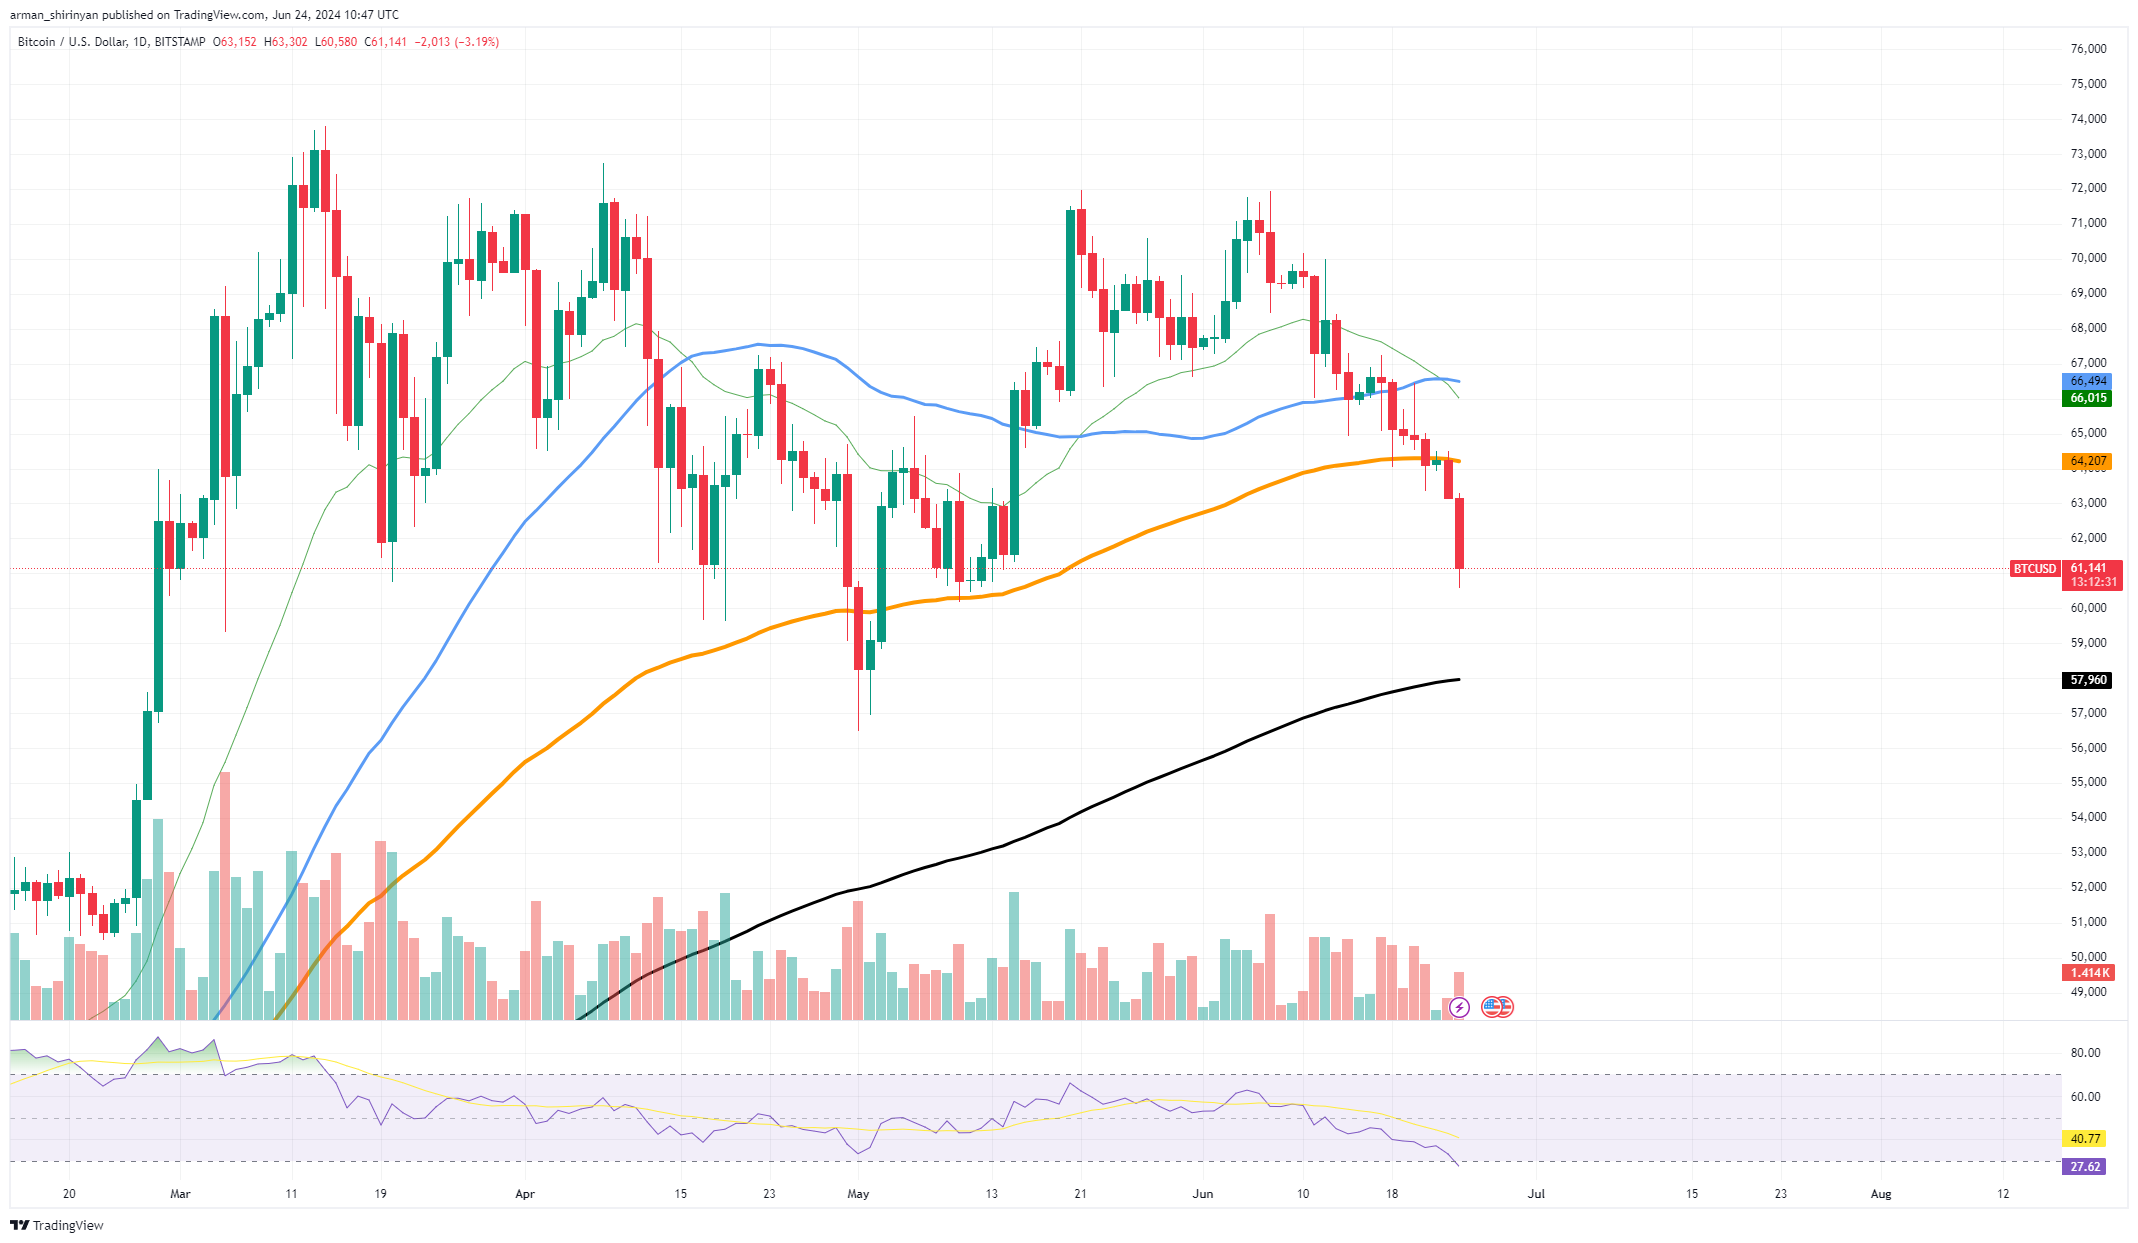
Bitcoin is currently experiencing a sharp decline, with the price of the digital gold plummeting below the $65,000 threshold. However, there is a schematic that may explain BTC's current moves and potentially provide us with hope.
A well-known technical analysis pattern for interpreting asset market behavior, especially during periods of accumulation and consolidation, is the Wyckoff Reaccumulation schematic.
According to this schematic, the current state of Bitcoin could be a part of a larger reaccumulation phase in which retail investors and strong hands are gradually accumulating BTC from each other.
Initial support level (PSY): Following a downtrend, this is the level of initial support, where substantial buying starts to occur, slowing the decline.
AdvertisementSelling climax (SC): The price point at which strong hands absorb heavy selling pressure, causing a sharp decline in price and a subsequent rebound.

Automatic rally (AR): When the selling pressure eases following a selling climax, prices rise automatically.
AdvertisementTest secondary (ST): To assess supply and demand levels, the price goes back to the selling climax area. Volumes on the decline may be declining, which indicates lessening selling pressure.
Spring: The price may briefly fall below the previous low (support) during this possible shakeout phase, which could lead to stop losses and panic selling before it swiftly rises again. The purpose of this move is to trap weak hands and bears.
Sign of strength (SOS): A new uptrend is signaled when the price breaks above the resistance with significant volume. The last measure of support before an asset makes a substantial upward move is called the Last Point of Support, or LPS.

The three-day chart indicates that this reaccumulation schematic appears to be what Bitcoin is doing. As of right now, Bitcoin appears to be testing support levels, which could mean that a big upward move is imminent.
The schematic suggests that after this phase of consolidation, Bitcoin could experience a strong upward impulse, potentially pushing prices back toward previous highs and beyond. While this pattern does not guarantee future performance, it provides a structured way to interpret market behavior and identify potential opportunities.
 Dan Burgin
 U.Today Editorial Team