Disclaimer: The opinions expressed by our writers are their own and do not represent the views of U.Today. The financial and market information provided on U.Today is intended for informational purposes only. U.Today is not liable for any financial losses incurred while trading cryptocurrencies. Conduct your own research by contacting financial experts before making any investment decisions. We believe that all content is accurate as of the date of publication, but certain offers mentioned may no longer be available.
The long-awaited reversal on Shiba Inu might be closer than ever with the MACD technical indicator showing the first signal of a mid-term reversal.
How the indicator functions
The MACD, or Moving Average Convergence Divergence, indicator is a widely-known tool for determining the reversal points of financial assets. The indicator utilizes two moving averages with periods of 12 and 26 that are used to signal bullish and bearish reversals.

Whenever moving averages cross each other in one or another direction, traders are able to determine if the asset is changing the direction of its movement or continuously moving down. In addition to moving averages, the indicator is also able to show the strength of the current with the help of a histogram.
What does MACD show for SHIB token?
According to the chart presented by TradingView, MACD already gave the reversal signal between Dec. 21 and 22. After the appearance of the signal, Shiba Inu has shown 3% growth, which is not a significant value for an asset that previously gained up to 200% per run.
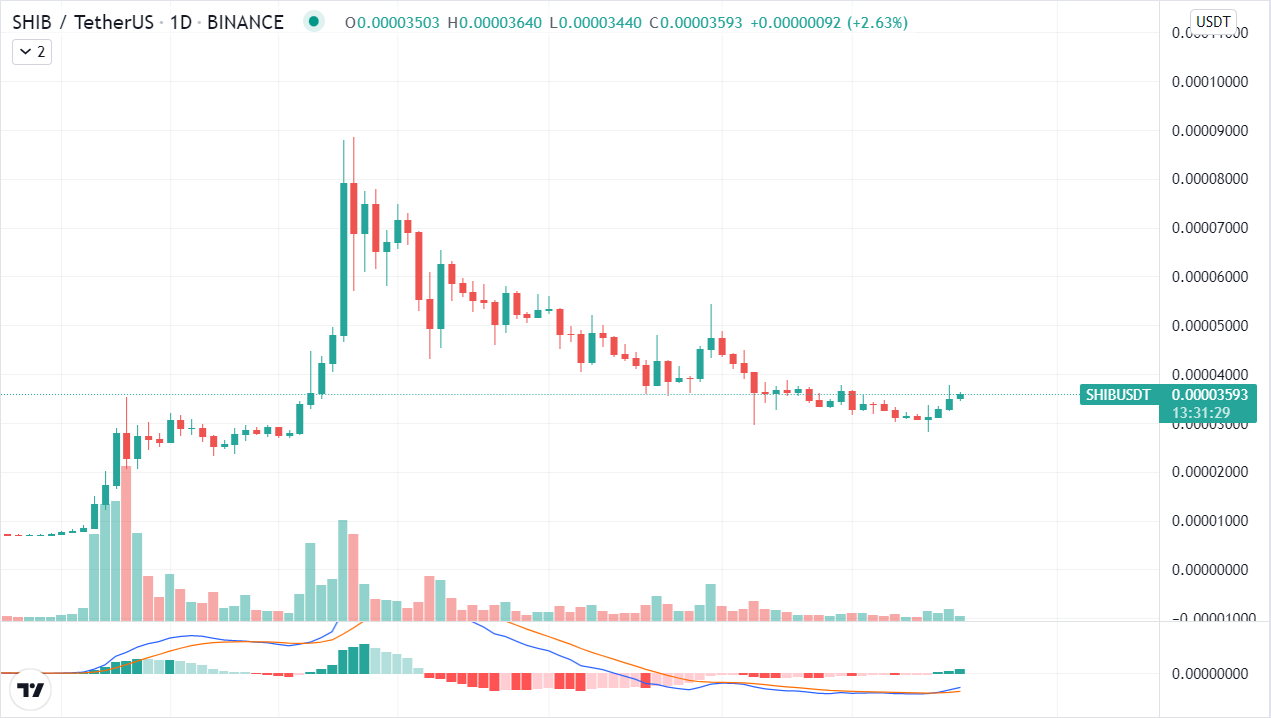
The reversal was warmly welcomed by traders and large investors who have purchased millions of dollars worth of tokens after the signal on the indicator appeared. In addition to moving averages, MACD's histogram confirms the change of the trend with downwards changing to upwards.
But while the indicator shows the short-term trend reversal, it does not give any valuable information about the potential of a new movement. Other technical and fundamental on-chain and market indicators suggest that Shiba Inu is currently in a more positive place compared to the 70% correction period.
At press time, the token trades with 2.6% daily growth, while the total weekly growth stays at approximately 22%.
 Dan Burgin
 U.Today Editorial Team