
Disclaimer: The opinions expressed by our writers are their own and do not represent the views of U.Today. The financial and market information provided on U.Today is intended for informational purposes only. U.Today is not liable for any financial losses incurred while trading cryptocurrencies. Conduct your own research by contacting financial experts before making any investment decisions. We believe that all content is accurate as of the date of publication, but certain offers mentioned may no longer be available.
Shiba Inu was on the verge of losing an important support level that held it before the catastrophe at the $0.00002 price level. However, it did not hold the selling pressure, opening up a way toward $0.00001 for Shiba Inu. Unfortunately, things are unlikely to change in the foreseeable future.
The first chart with a daily time frame illustrates the sharp decline that occurred when SHIB breached the support level at $0.00002. The price is now being driven even lower by the strong selling pressure created by this breakdown.
Although SHIB is currently in oversold territory according to the RSI, the downward momentum may still continue. Two crucial zones where a possible reversal may occur are $0.000015 and $0.00001.

These psychological levels might serve as a bridge offering momentum and a break from the constant selling pressure. This is a critical point where buyers may intervene in an attempt to catch the falling knife.
The $0.00001 level is also very important. This threshold could offer more reliable support if SHIB keeps declining. These kinds of round numbers have historically drawn buying interest, and they might provide a stronger foundation for a rally.
Multi-month lows: As of earlier this year, the last meaningful level is located at multi-month lows. A crucial test of SHIB's resilience would be if it brakes through the $0.00001 support and heads toward these lows.
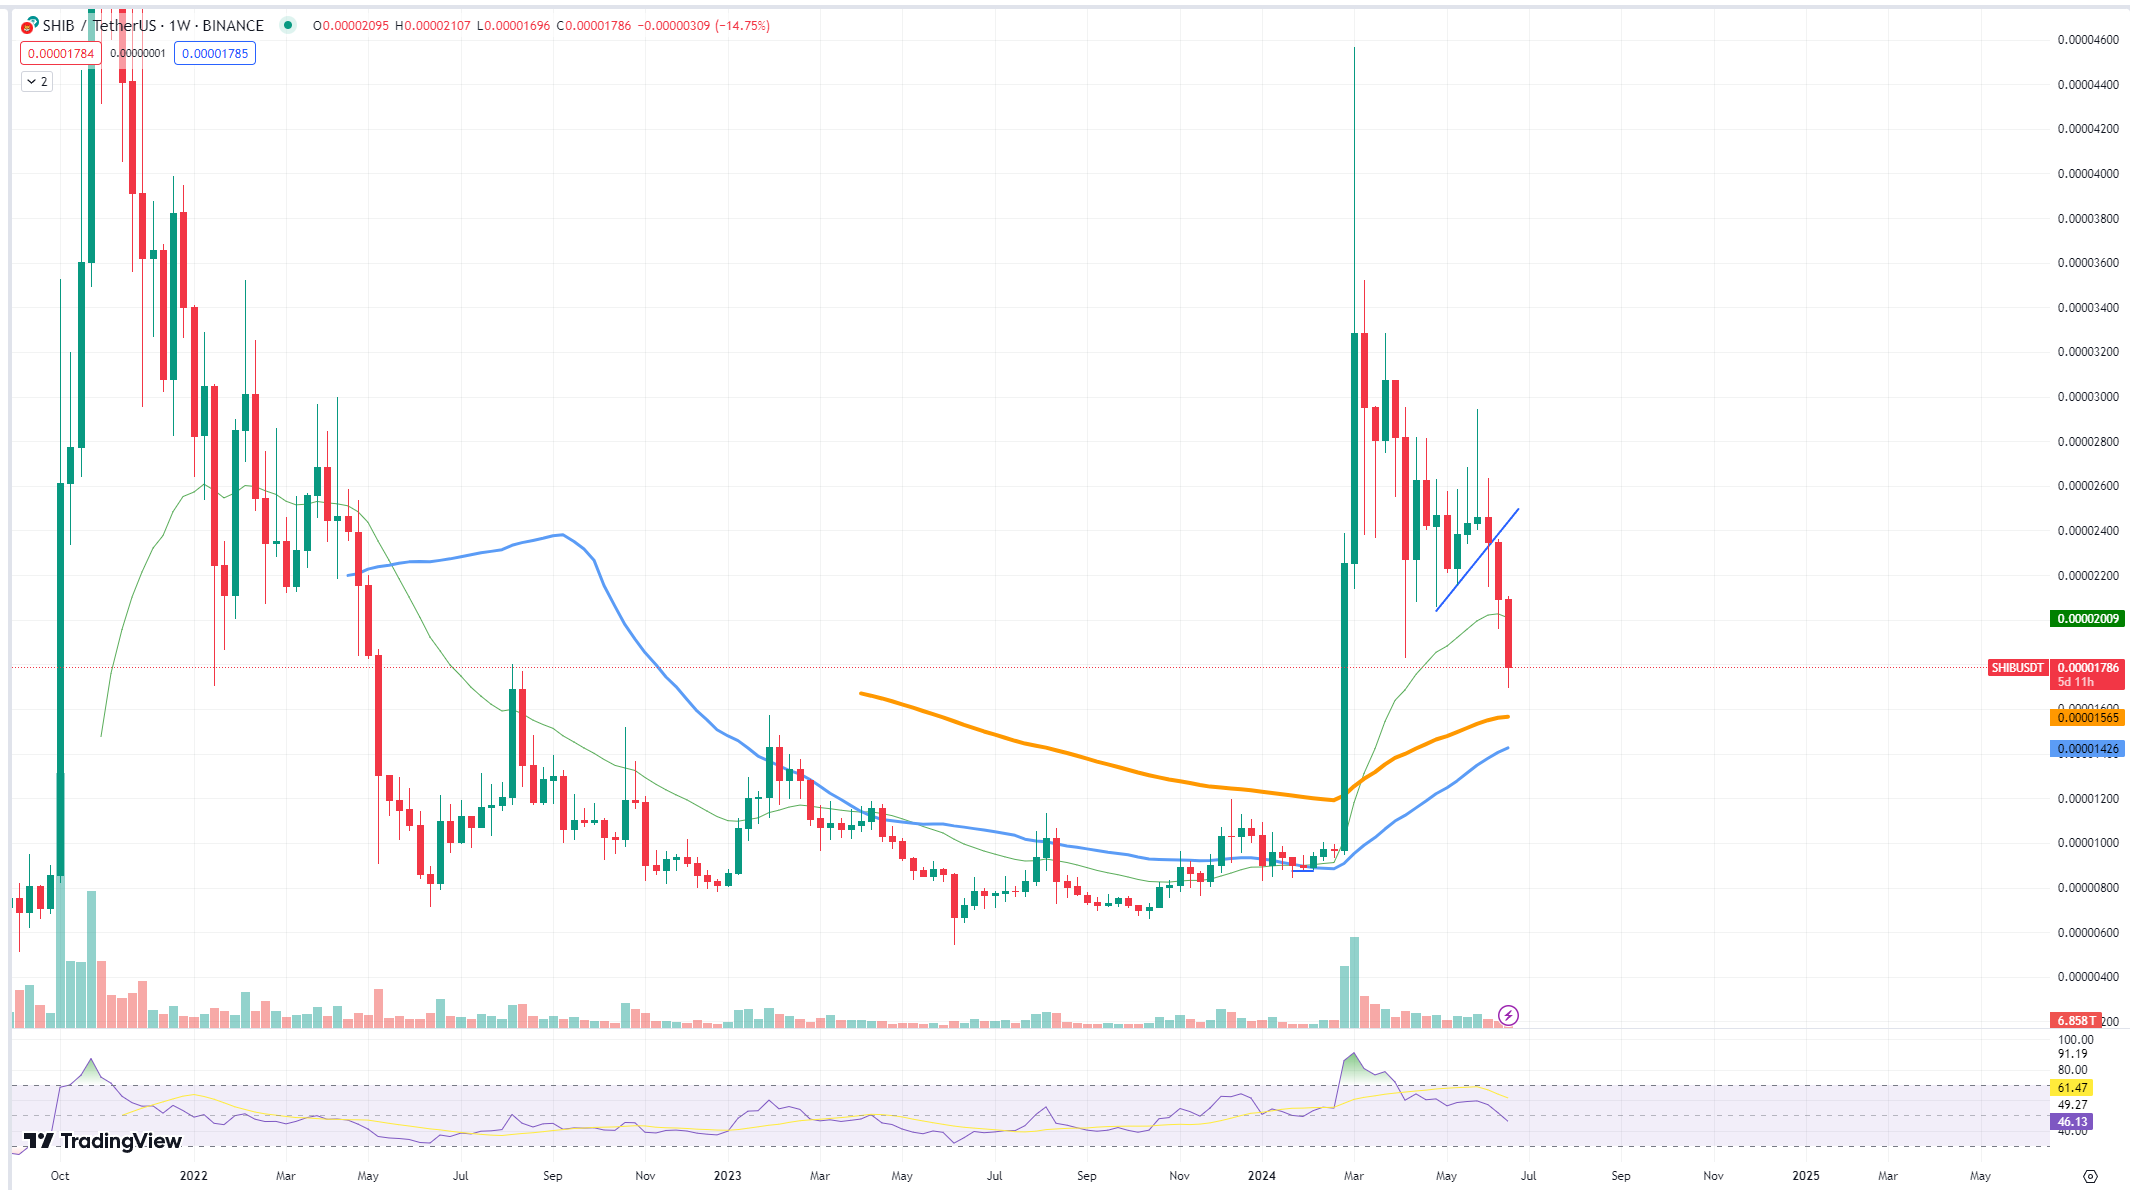
A more comprehensive view of SHIB's price action is provided by the second chart, which is displayed on a weekly basis. It displays the major resistance encountered at the $0.00002 level while highlighting the long-term support levels and the general trend. A reversal may not occur right away based on the weekly RSI's indication of oversold conditions and the current bearish sentiment on the market.
 Dan Burgin
 U.Today Editorial Team