
Disclaimer: The opinions expressed by our writers are their own and do not represent the views of U.Today. The financial and market information provided on U.Today is intended for informational purposes only. U.Today is not liable for any financial losses incurred while trading cryptocurrencies. Conduct your own research by contacting financial experts before making any investment decisions. We believe that all content is accurate as of the date of publication, but certain offers mentioned may no longer be available.
The recent market decline has made it difficult for Shiba Inu to regain its bullish momentum. Technical indicators, however, point to the possibility of a golden cross formation developing earlier than anticipated, which could support a robust recovery for SHIB despite the uncertainty. Following the failure of a breakout rally, SHIB has been consolidating close to its recent lows.
Despite currently trading below important moving averages, the asset has demonstrated resilience by holding onto its support level. Since SHIB has a history of significant breakouts after protracted accumulation, investors may find its current position to be an alluring entry point. A short-term moving average crossing above a long-term moving average is known as a golden cross, a bullish technical pattern that is usually interpreted as a strong buy signal. The golden cross may soon appear if SHIB keeps up its slow recovery.
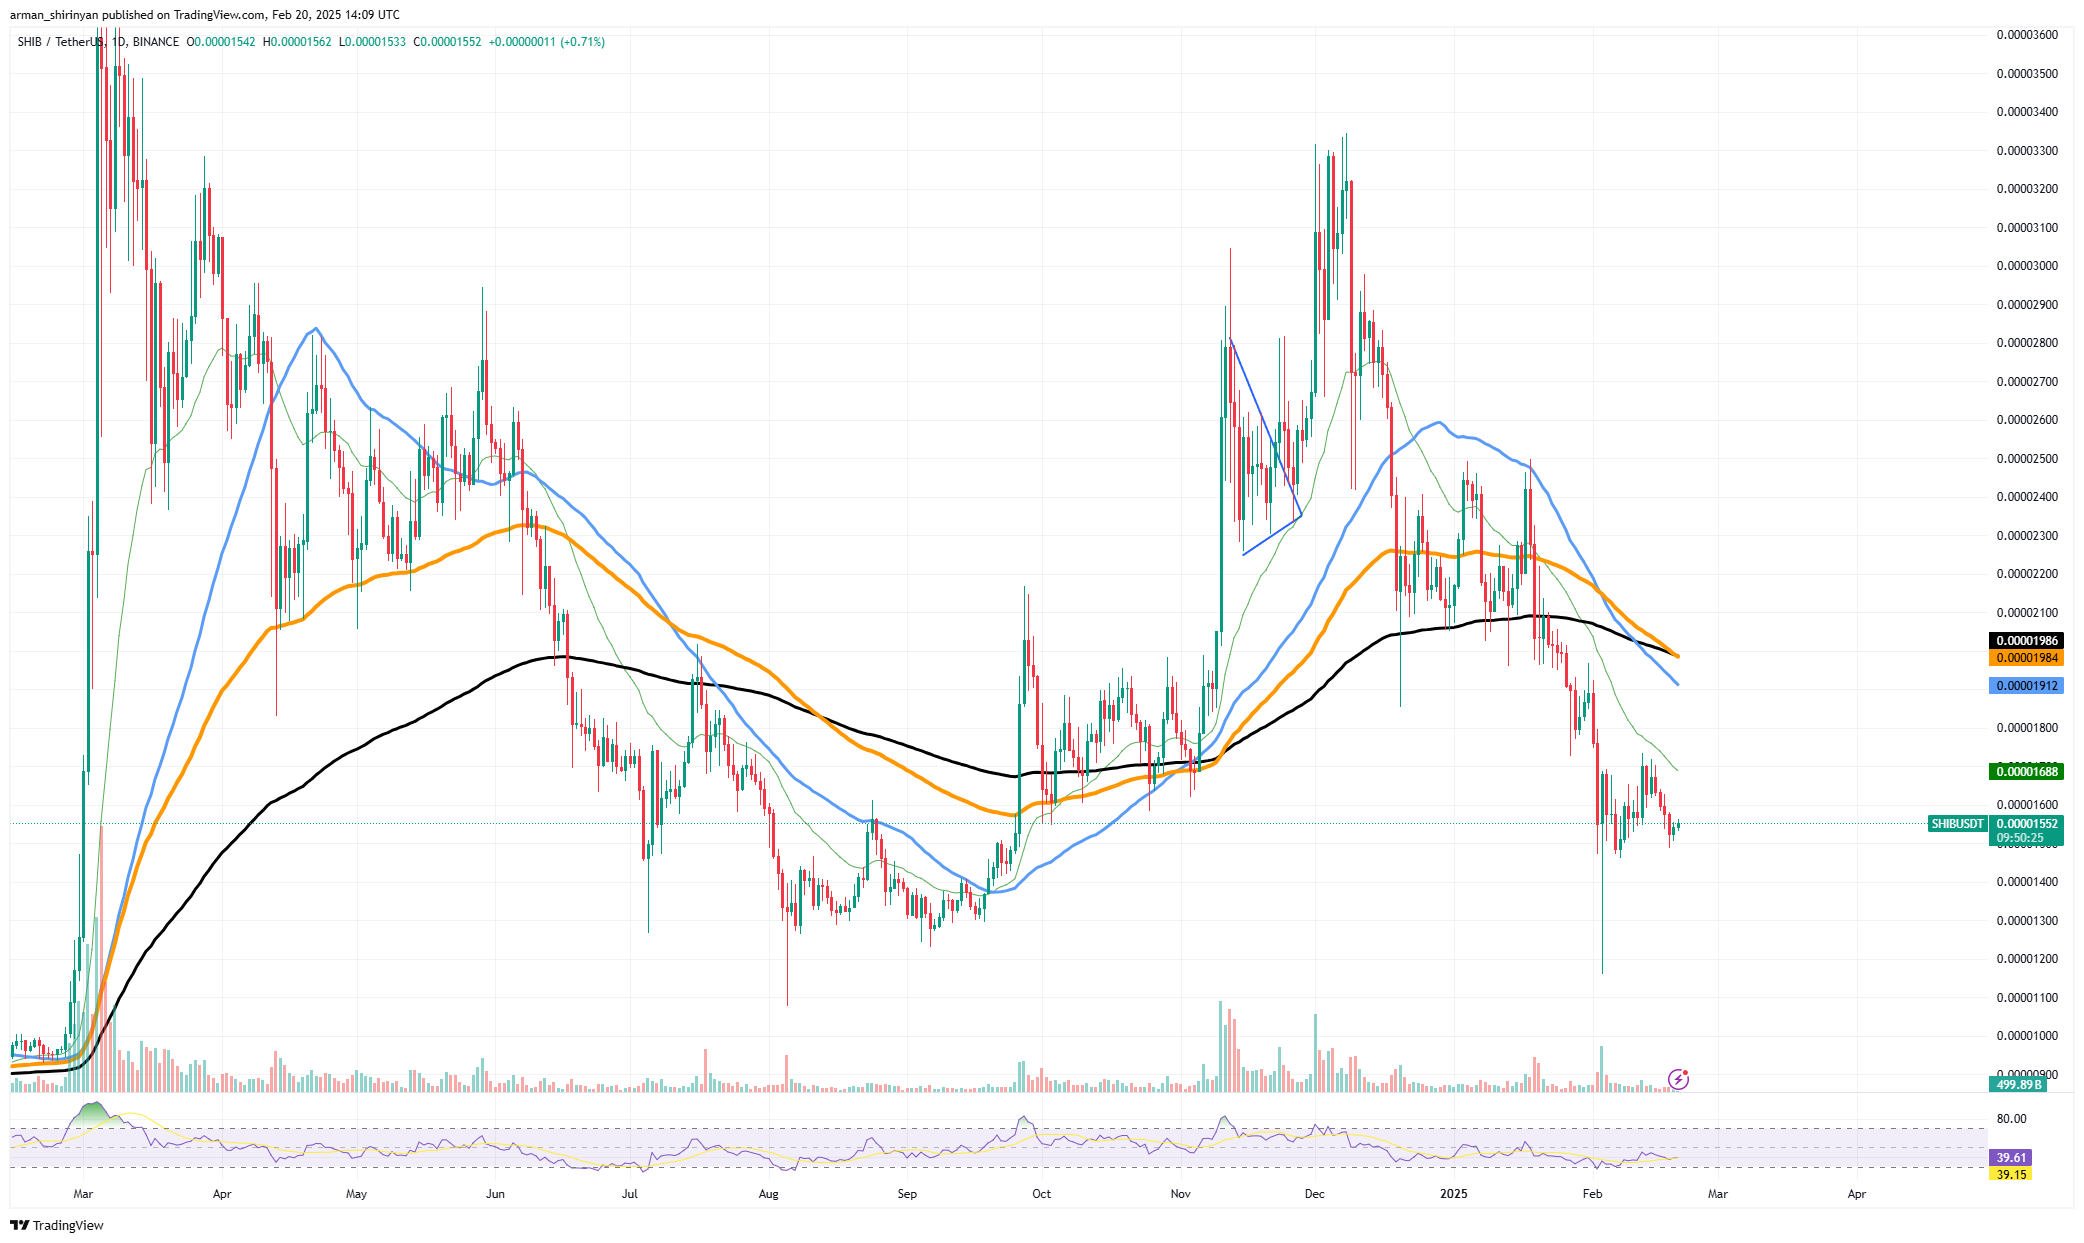
The 50-day moving average is getting closer to the 200-day moving average. In the past, this pattern has come before significant uptrends in SHIB, so a verified crossover would probably draw more buyers to the market. For SHIB to resume its bullish trajectory, however, crucial resistance levels around $0.00001900 and $0.00002100 need to be breached.
Volume is still a major worry, even though the possibility of a golden cross makes for a bullish case for SHIB. The lack of strong buying pressure during recent recoveries may postpone a long-term breakout. SHIB may see a quick move toward higher resistance levels if volume begins to increase.
Solana has some potential
Following weeks of steady decline, Solana's first significant price increase in days suggests a possible reversal. SOL has recovered above $170, signaling a significant change in sentiment after a multi-week drop. Following a sharp decline that saw SOL lose almost 45% of its value from its local peak, the action was taken. SOL is currently encountering immediate resistance at about $189, which is in line with its 200-day moving average (black line).
Selling pressure has historically increased in the next resistance zone, which is $203-$210. A break above this level could confirm a trend reversal and pave the way for a push toward this area. Support for SOL is currently located close to $165 on the downside. This level has now turned into a critical support zone after serving as strong resistance during the asset's prior uptrend.

A retest of the $150-$155 range is probable if SOL is unable to hold this level, which could slow the pace of its recovery. A moderate increase in buying pressure, indicated by volume analysis, indicates that investors are once again interested. The Relative Strength Index (RSI) may support a short-term rebound as it has begun to recover from oversold levels.
A strong breakout is not yet confirmed, though, due to the lack of significant bullish volume. The larger market environment is another element to keep an eye on. If Ethereum and Bitcoin continue to be strong, Solana might pick up more steam. SOL's recovery might not last long if the cryptocurrency market as a whole declines.
Ether not stabilizing
With its price stabilizing above the $2,700 mark and forming a structure that might indicate an imminent breakout, Ethereum has been exhibiting indications of a possible recovery. Nevertheless, the asset is still in a risky position because it is having trouble recovering important moving averages that might determine its next significant move. Though it has increased by more than 1% in the last day, the price of ETH is still far below its recent highs.

Although a full recovery may be hampered by resistance levels at $3,000 and $3,100, the recent increase in volume suggests that market interest is growing. The level of $2,600 is serving as a critical support area on the downside. The likelihood of a further decline toward $2,400 or even $2,200 rises if Ethereum is unable to maintain above this level. Ethereum must break above the 50-day moving average, which is presently trading at about $3,000, in order to make a successful breakout.
A rise above this mark would indicate bullish momentum and might pave the way for a midterm move toward $3,300 or even $3,500. On the other hand, if resistance is not overcome, there may be another leg down, particularly if the overall state of the market is still negative.
As of right now, the Relative Strength Index (RSI) is in a neutral range, indicating that neither buyers nor sellers have a definite advantage. Ethereum is still undergoing consolidation, and although a breakthrough could happen soon, there is still a lot of opposition to the asset. What happens with ETH next will mostly depend on how the market responds to macroeconomic events and the general mood in the cryptocurrency space.
 Dan Burgin