Disclaimer: The opinions expressed by our writers are their own and do not represent the views of U.Today. The financial and market information provided on U.Today is intended for informational purposes only. U.Today is not liable for any financial losses incurred while trading cryptocurrencies. Conduct your own research by contacting financial experts before making any investment decisions. We believe that all content is accurate as of the date of publication, but certain offers mentioned may no longer be available.
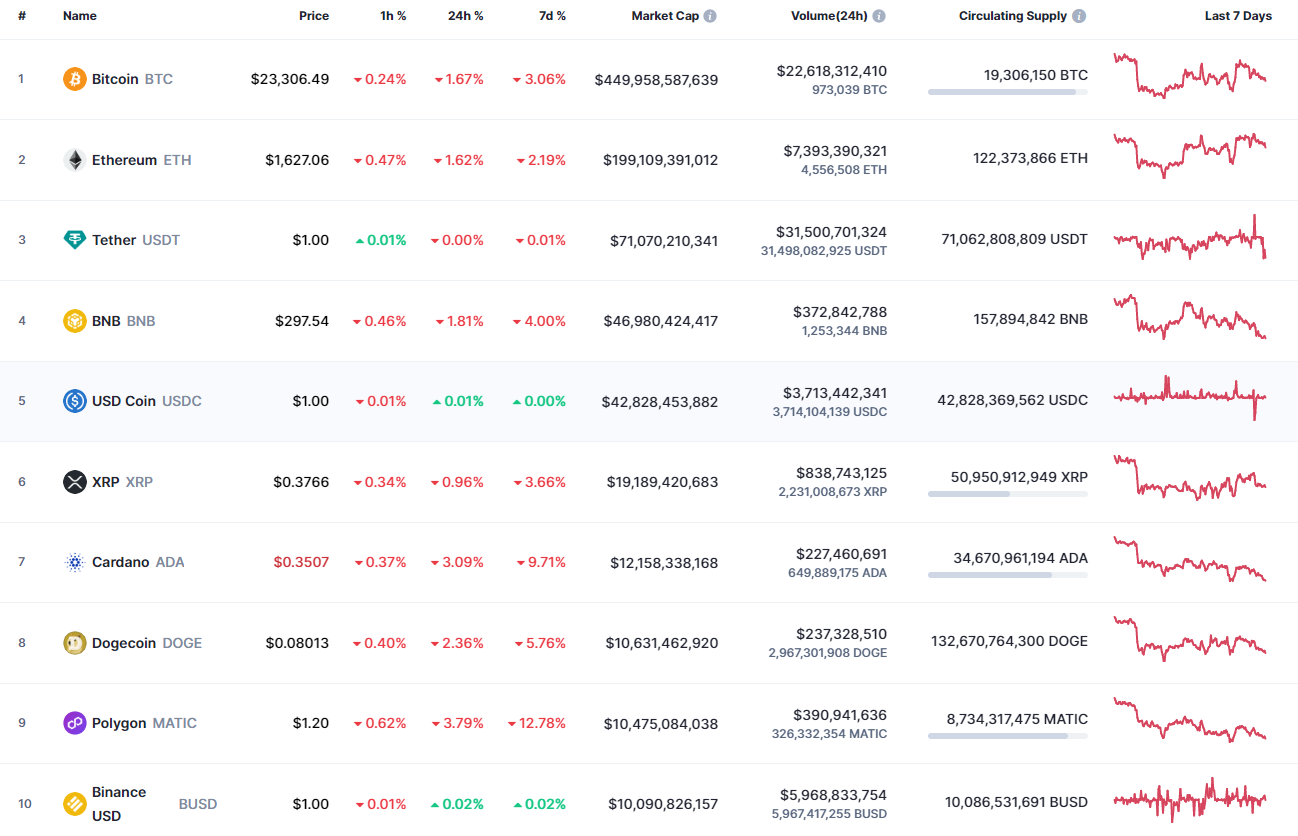
Bears have returned to the game, according to the CoinMarketCap ranking.
SHIB/USD
SHIB has followed the decline of most of the other coins, going down by 3.52%.
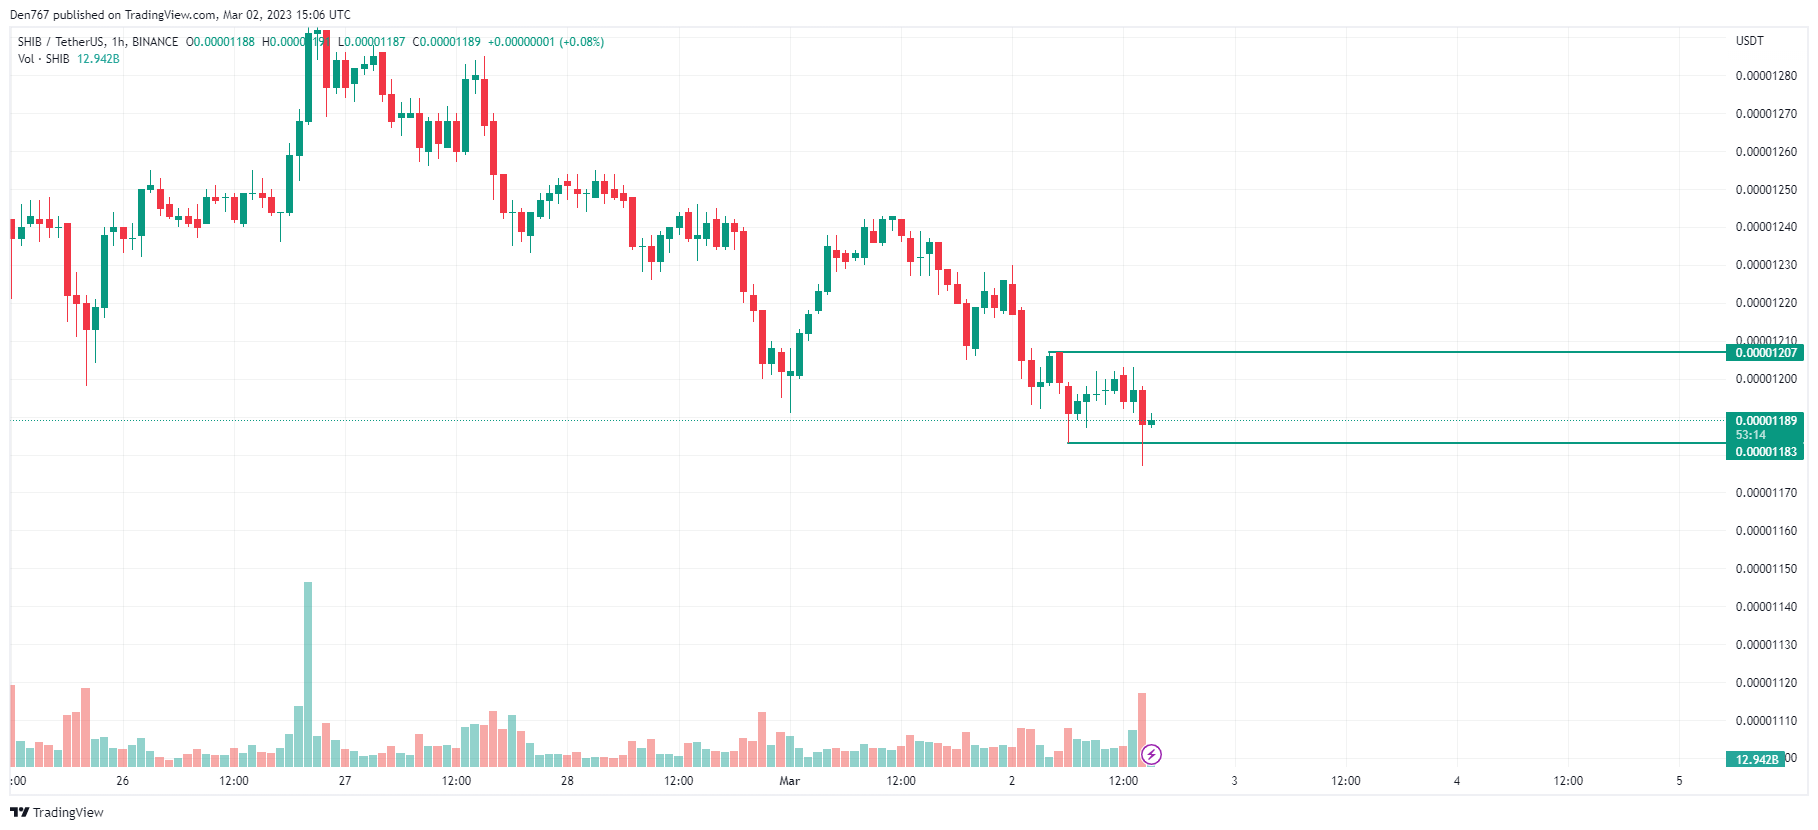
Despite sellers' pressure, the price of SHIB has made a false breakout of the recently formed support level at $0.00001183. If the bar closes above it, bulls have a chance to bounce back to the $0.000012 zone.
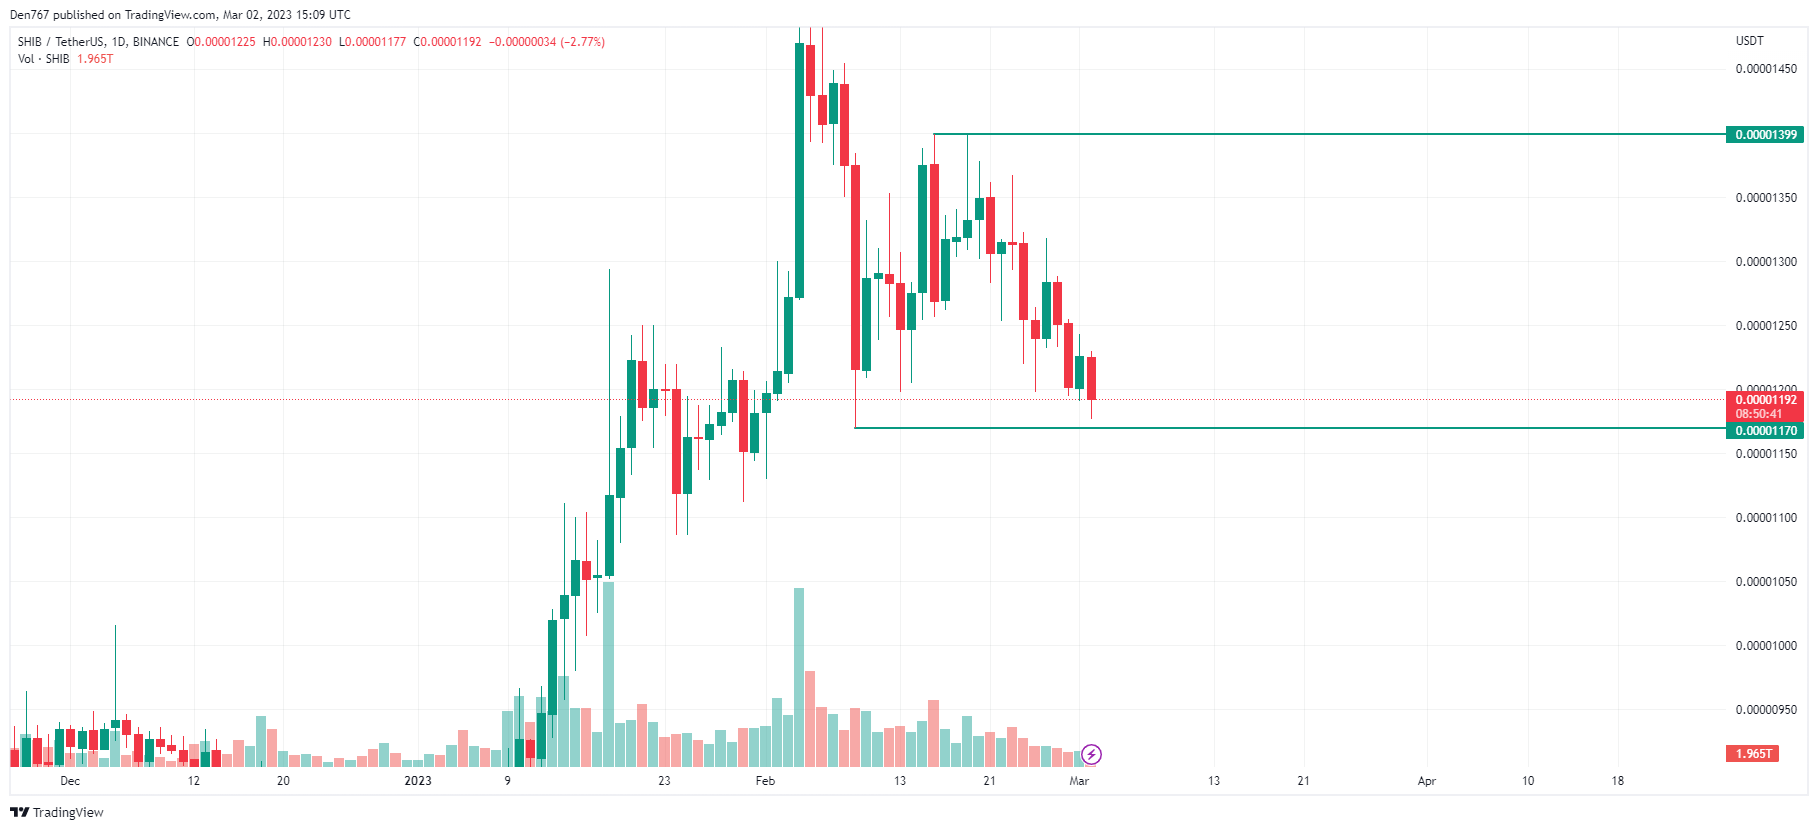
On the bigger time frame, the price is approaching the support at $0.00001170. That level plays a key role for bulls in terms of a possible rise. If they lose it, the accumulated energy can be enough for a downward move to the $0.000011 zone.
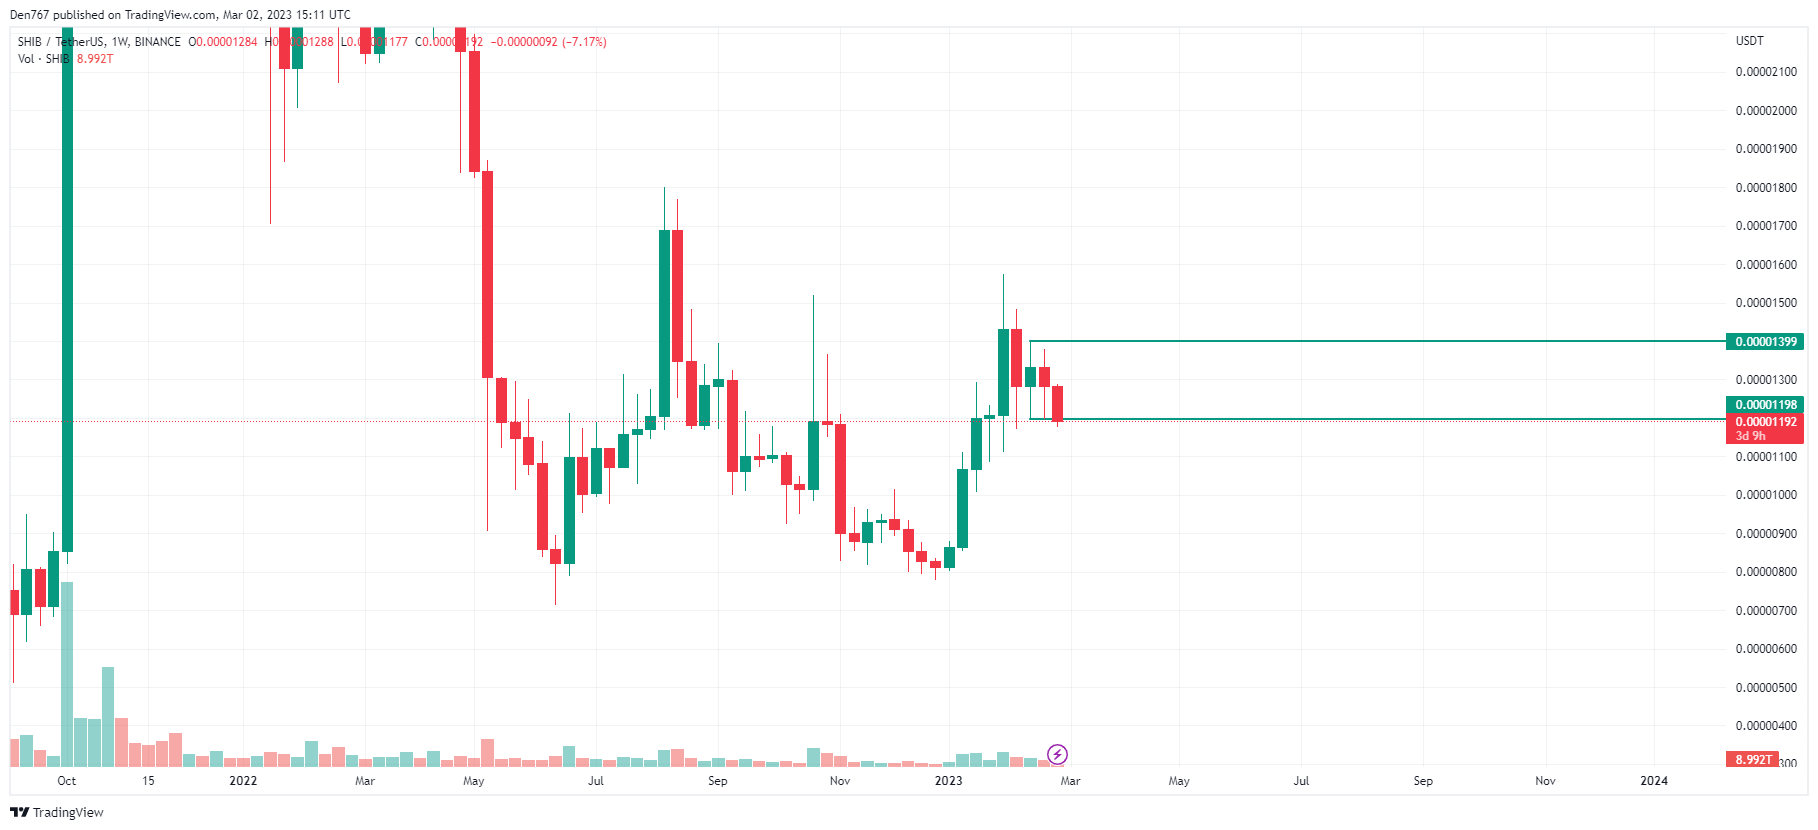
From the midterm point of view, SHIB is about to close below the previous candle low at $0.00001198. If that happens, the decline may continue to the test of the $0.000010 mark.
Such a scenario is relevant until the end of the month.
SHIB is trading at $0.00001190 at press time.
 Dan Burgin