
Disclaimer: The opinions expressed by our writers are their own and do not represent the views of U.Today. The financial and market information provided on U.Today is intended for informational purposes only. U.Today is not liable for any financial losses incurred while trading cryptocurrencies. Conduct your own research by contacting financial experts before making any investment decisions. We believe that all content is accurate as of the date of publication, but certain offers mentioned may no longer be available.
The crypto market's recent recovery has seen a notable breakout star: Pepe (PEPE). The cryptocurrency has notched a remarkable 63% increase in value since the market turnaround began. This surge has not just been a case of riding the wave; PEPE has managed to overcome numerous resistance levels, effectively outpacing the prevailing selling pressure.
However, investors need to remain circumspect despite these exciting gains. When PEPE plummeted to an all-time low (ATL), the liquidity it had to work with was close to nonexistent. This lack of liquidity implies that even the most minute inflow of capital would set it on an upward trajectory.
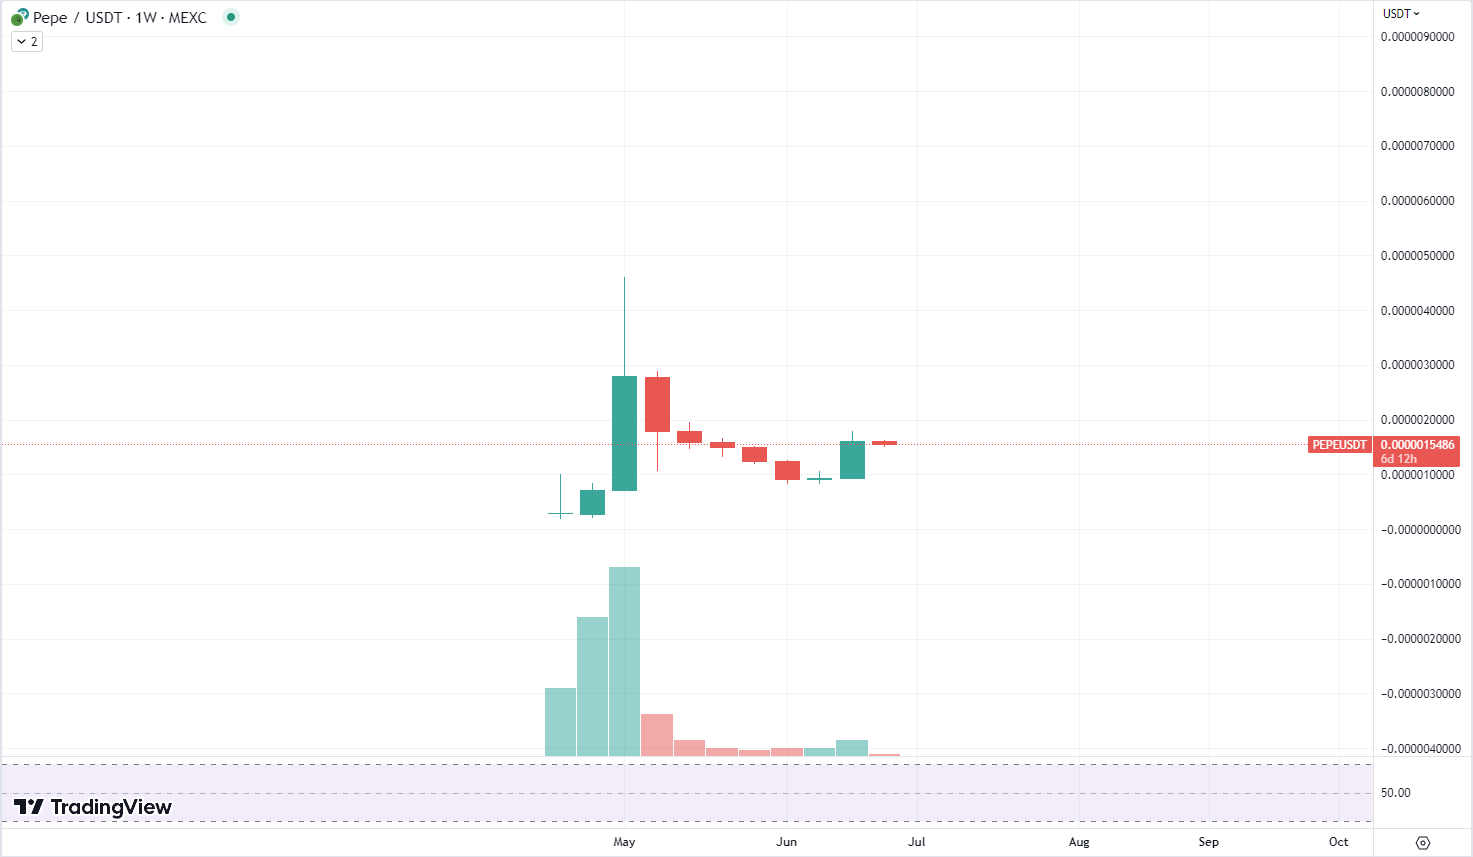
So, where might these inflows be coming from? A plausible answer lies in the developers who previously cashed out their "premines" at high levels. This cashing out, coupled with the market recovery, could have catalyzed the recent PEPE rally. Essentially, the funds that enabled PEPE's rise may not be indicative of broad market sentiment or new investment but rather a restructuring of capital within the PEPE ecosystem itself.
This perspective highlights a crucial consideration for investors: not all rallies are built the same. While PEPE's current surge is undoubtedly impressive, it may be riding on the back of unique internal dynamics, rather than representing a change in wider market perception or value.
XRP finds support
XRP is currently teetering on the edge of a pivotal price point. The currency is hovering around the $0.48 mark, but a closer look at the charts suggests it could be poised to hit the trendline support level at $0.46. This scenario, counterintuitively, might not be all bad news but could instead lay the groundwork for a continued rally.
Technical analysis provides a two-sided perspective for the currency's path. On the one hand, the proximity to the trendline support level could set the stage for a bounce. If investors perceive this as an attractive entry point, their buy orders could inject some much-needed momentum into XRP's market performance, potentially leading to a price rebound.
However, this potential uptick should be considered against a backdrop of somewhat disconcerting on-chain metrics in a short-term perspective. Trading volume and network activity for XRP are currently in a state of decline. Furthermore, the growth rate of the total number of addresses holding XRP is also showing signs of slowing down. These trends, when taken together, may signal a bearish trend reversal rather than a bullish bounce.
While a drop in price is typically seen as negative, this impending dip might have a silver lining. If XRP lands on the $0.46 support level and successfully holds it, the event could be interpreted as a confirmation of this level as a solid base. It could thus inspire confidence among traders and potentially catalyze a buying spree that could reverse the bearish tide and initiate a bullish rally.
Arbitrum cannot break through
Arbitrum (ARB) has been striving to overcome a formidable barrier: the 50-day Exponential Moving Average (EMA). This resistance level has proven insurmountable for ARB, with the asset wrestling with it for over five days, and despite favorable background factors, it is still failing to break free.
On a fundamental level, the signs pointed toward a possible surge. Network activity and trading volumes indicated a thriving environment that could potentially support a breakout. Nevertheless, these promising indicators did not translate into the growth anticipated. ARB's failure to rally sufficient support and liquidity has hampered its ascent, keeping it caged below the 50 EMA.
While the cryptocurrency market showed increasing risk-on tendencies, signaling a potential appetite for higher-risk investments, it was not enough to bolster ARB's stance. Even with broader market conditions seemingly ripe for growth, ARB has remained relatively stagnant, hinting at the depth of the resistance it faces.
Currently trading at $1.13, ARB's struggle to break through the 50 EMA illustrates a core truth of the crypto market: resistance levels, particularly those rooted in key moving averages, can often act as significant roadblocks to an asset's price trajectory. They are a critical battleground where bullish and bearish sentiments collide, often deciding the asset's future direction.
 Dan Burgin
 U.Today Editorial Team