
Disclaimer: The opinions expressed by our writers are their own and do not represent the views of U.Today. The financial and market information provided on U.Today is intended for informational purposes only. U.Today is not liable for any financial losses incurred while trading cryptocurrencies. Conduct your own research by contacting financial experts before making any investment decisions. We believe that all content is accurate as of the date of publication, but certain offers mentioned may no longer be available.
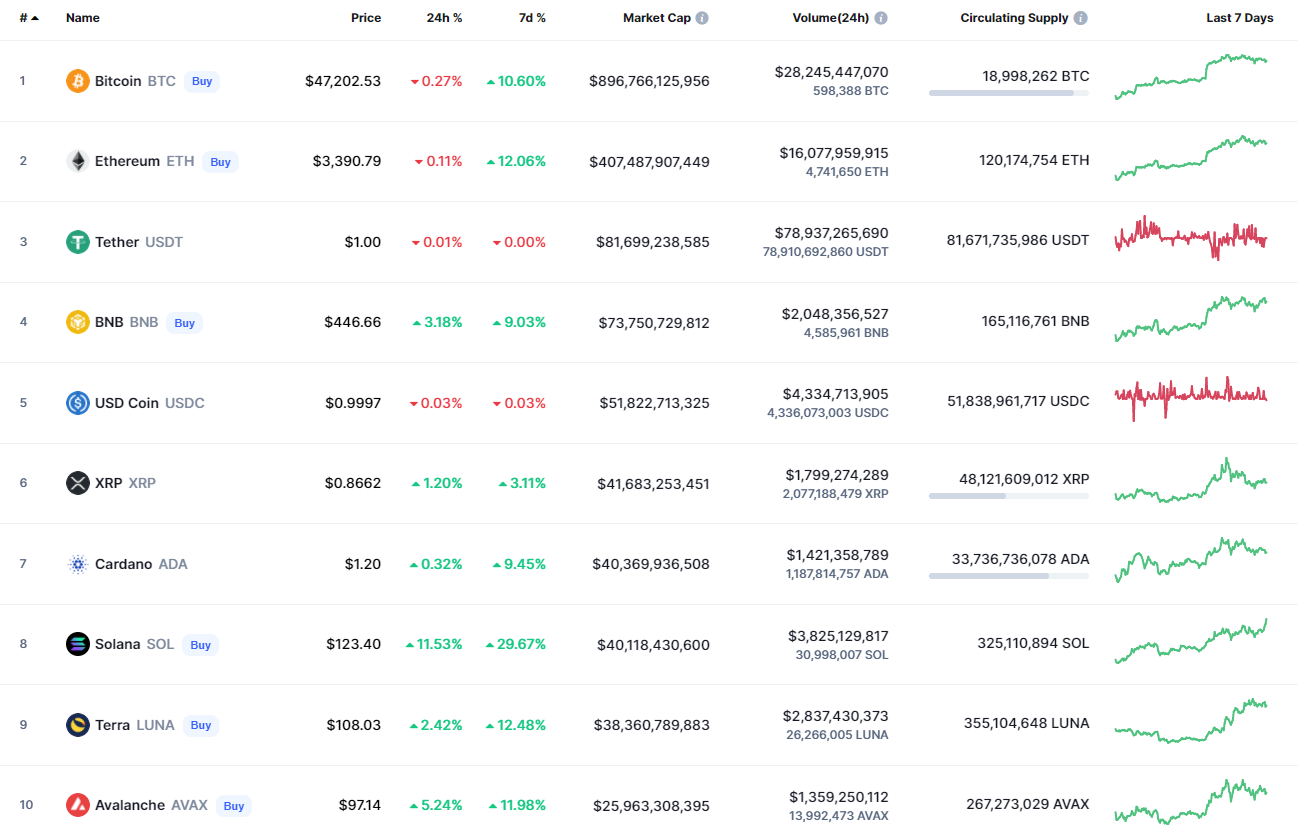
By the end of the week, bulls have come back to the game, with most of the coins trading in the green zone once again. Bitcoin (BTC) and Ethereum (ETH) are the only exceptions, falling by 0.41% and 0.31%, respectively.
KCS/USD
KuCoin Token (KCS) could not maintain the growth, falling by 1.18% since yesterday. Meanwhile, it has risen above 15% over the past week.
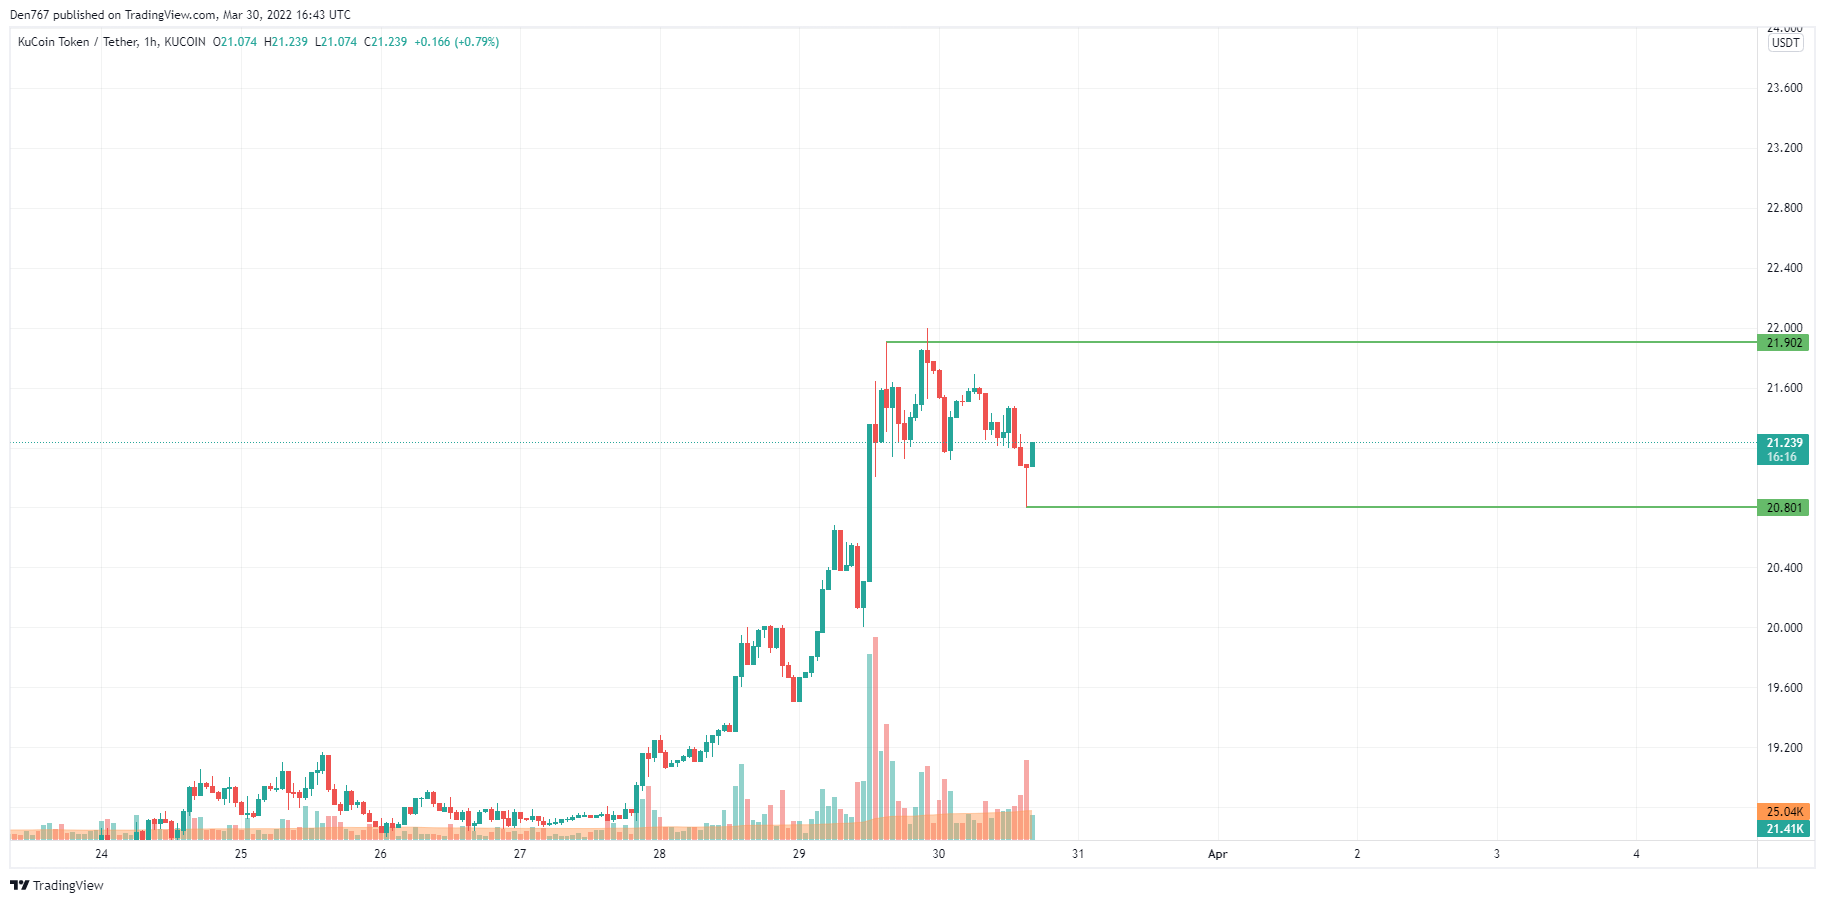
On the hourly chart, the KuCoin token (KCS) has formed a local support level at $20.80, while the resistance is located at the mark of $21.90.

In this case, sideways trading between the mentioned levels remains the most likely scenario. The declining trading volume also confirms such price action.
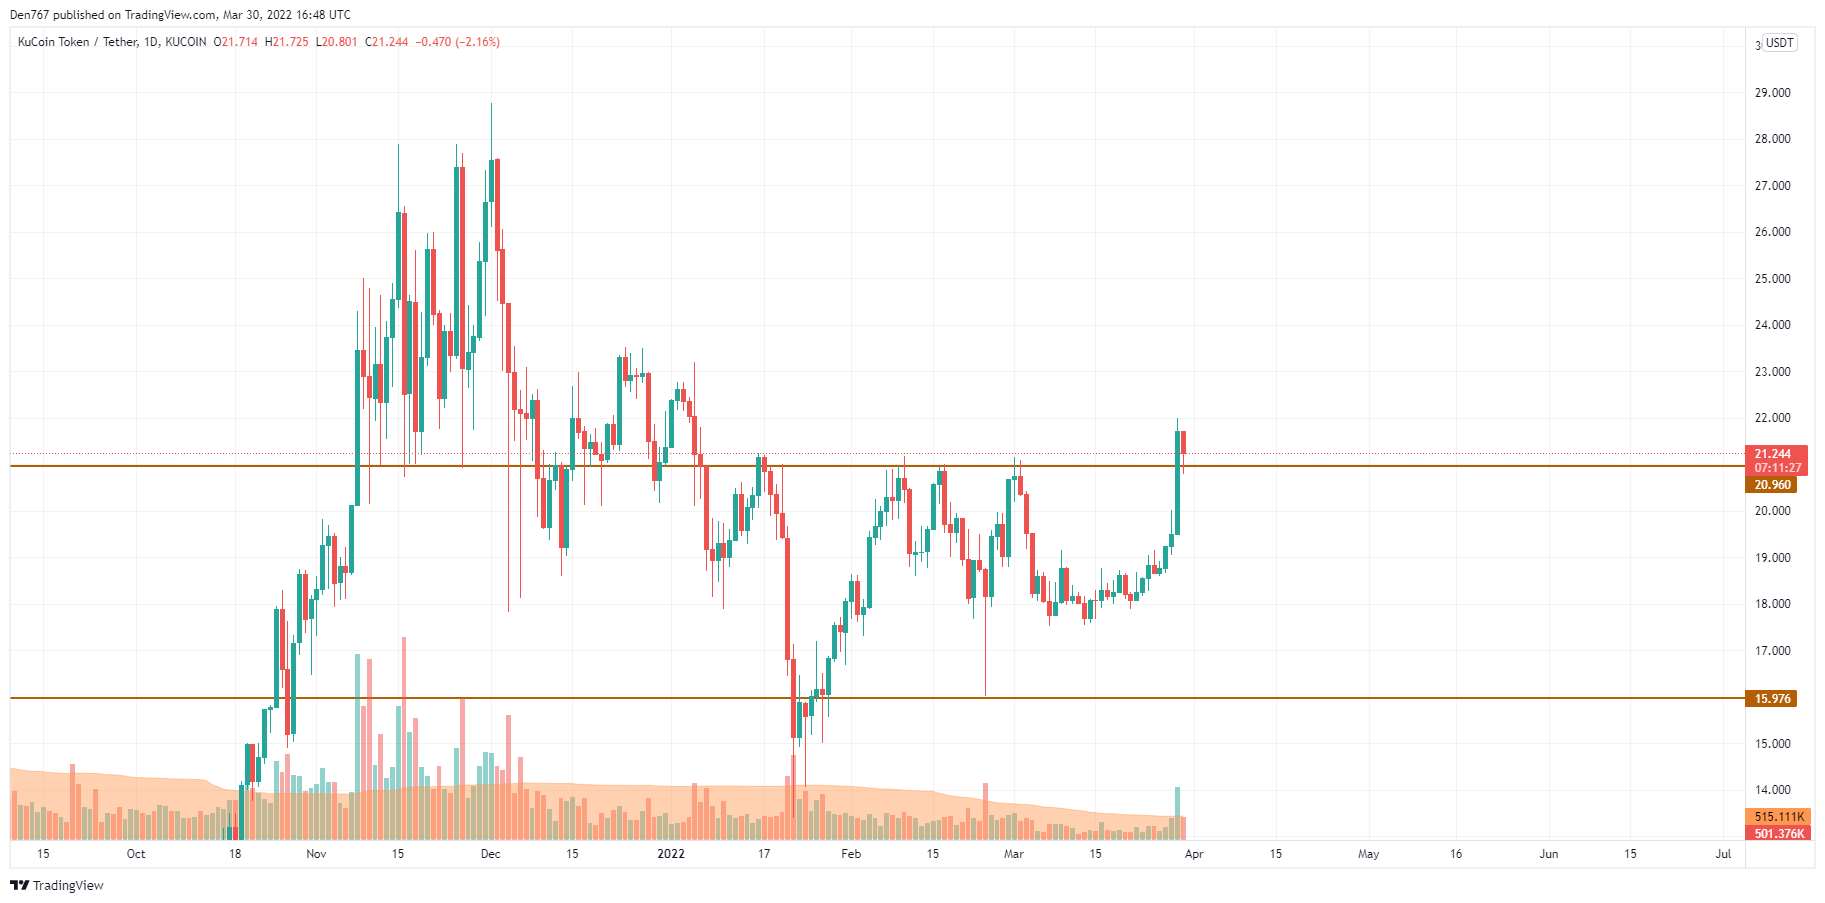
On the bigger time frame, KCS has bounced off the level at $20.96, which served the resistance recently. If bulls can hold the price above it, there is a chance of seeing sustained growth within the next days.

In addition, the buying trading volume has increased that also confirms the bulls' dominance over bears. However, if sellers manage to seize the initiative, the breakout of $20.96 may lead to a further drop to the zone around $20.
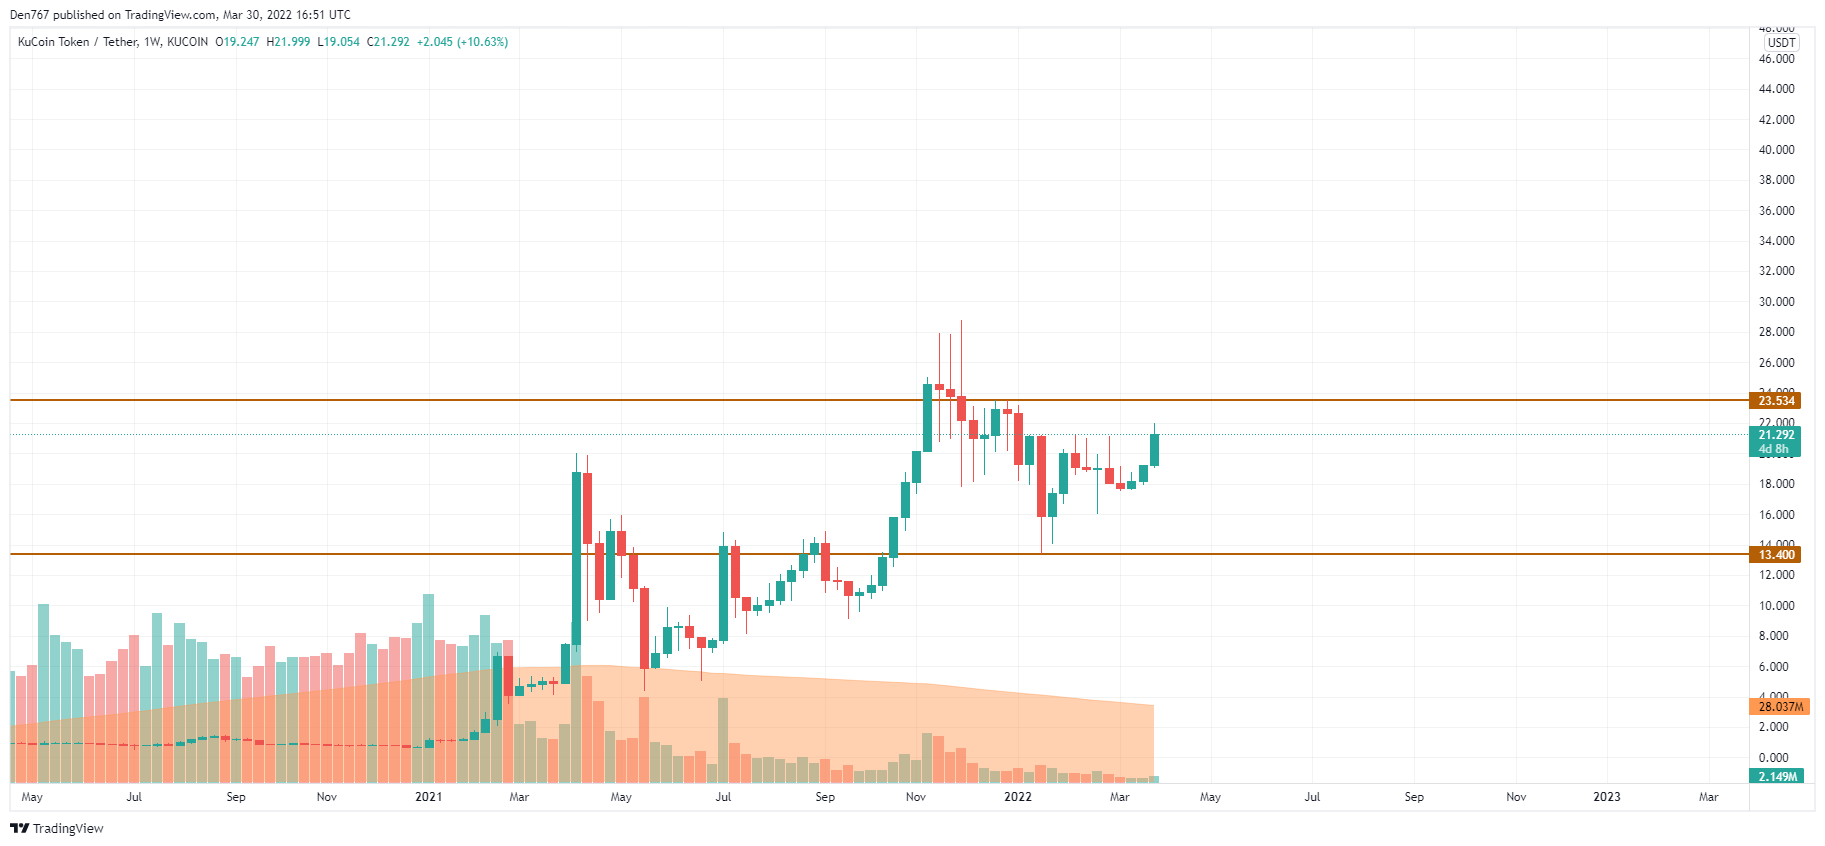
On the weekly chart, KCS is approaching the upper channel limit at $23.534. At the moment, one needs to pay close attention to the zone around $22. If the candle can fix above it, buyers may try to break the resistance and keep the rise to $30. However, a few weeks may pass until the rate reaches mentioned mark.
KCS is trading at $21.27 at press time.
 Dan Burgin
 U.Today Editorial Team