Disclaimer: The opinions expressed by our writers are their own and do not represent the views of U.Today. The financial and market information provided on U.Today is intended for informational purposes only. U.Today is not liable for any financial losses incurred while trading cryptocurrencies. Conduct your own research by contacting financial experts before making any investment decisions. We believe that all content is accurate as of the date of publication, but certain offers mentioned may no longer be available.
While yesterday, Bitcoin (BTC) was almost the only coin that rose, today, the situation is the opposite. Altcoins are back in the game, growing more than the leading crypto. The top gainer is Ethereum (ETH), whose rate has rocketed by 7.15% over the past day.
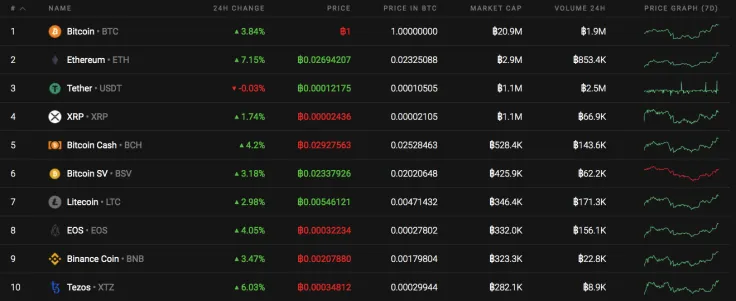
The ongoing rise of the cryptocurrency market has positively influenced its market capitalization, which has increased only slightly since yesterday, now sitting at $262.5 Bln.
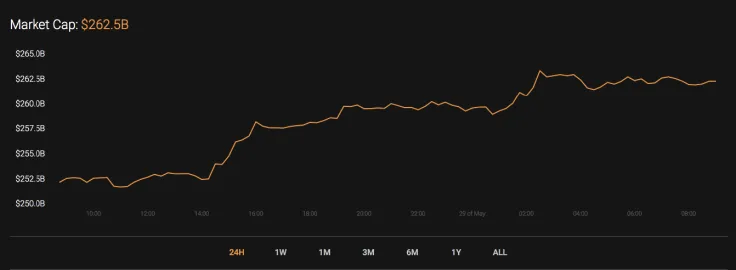
The relevant data for Ethereum is below.
-
Name: Ethereum
Advertisement -
Ticker: ETH
-
Market Cap: $24 571 584 186
-
Price: $221.12
Advertisement -
Volume (24h): $13 678 571 280
-
Change (24h): 7.35%
The data is relevant at press time.
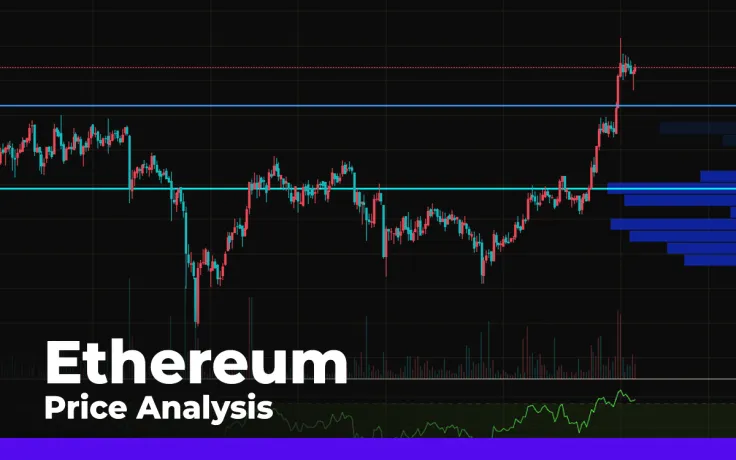
ETH/USD: Could Ethereum grow faster than Bitcoin during the possible bull run?
Ethereum (ETH) has kept up with the growth of the main crypto. Moreover, it has even surpassed it, having increased by more than 7%.
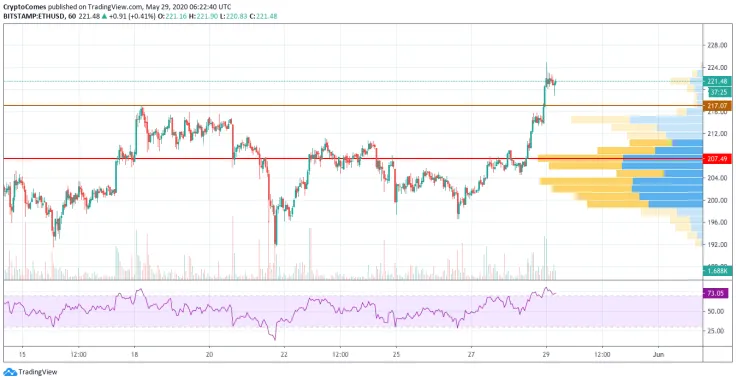
On the hourly chart, Ethereum (ETH) has reached the local peak at almost the $225 mark. At the moment, the coin is already oversold based on the value of the RSI indicator. Also, there is no liquidity above to push the rate higher. In this regard, a more likely forecast is a correction to the nearest vital level at $217. This will be just a rollback and not the start of a bearish trend.
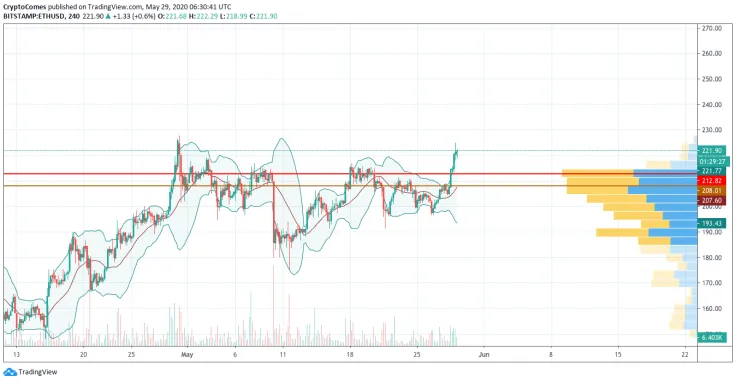
On a bigger time frame, the situation is also not so positive for Ethereum (ETH) holders. The support line of the Bollinger Bands indicator is looking down while the basic and the resistance are going up. This is a signal that bulls are running out of fuel and a decline may happen soon. If that happens, the rate will correct to the $208-$210 range soon.
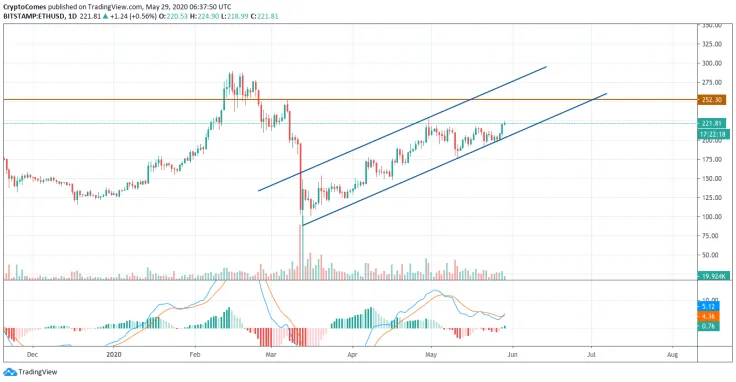
On the daily chart, the situation is quite the opposite. The long-term bullish trend has just started as the lines of the MACD indicator have crossed each other. What is more, the current rise is supported by the relatively high buyer trading volume. In addition, Ethereum (ETH) has still not left the borders of the rising channel, confirming the presence of bulls. All in all, the end-point of the current rise is the $252 mark, which may be reached by the end of June 2020.
Ethereum is trading at $221.12 at press time.
 Tomiwabold Olajide
 Alex Dovbnya
 Arman Shirinyan