Now that cryptocurrencies have started falling down, traders are rethinking their strategy. Which is the best? Play on shorts or hodl? It depends on many factors, including the cryptocurrency in question. Let’s find out why Ethereum turns out to be a nice long-term investment in the current market conditions. Read Ethereum price predictions from TradingView experts.
The fractal from the past repeats

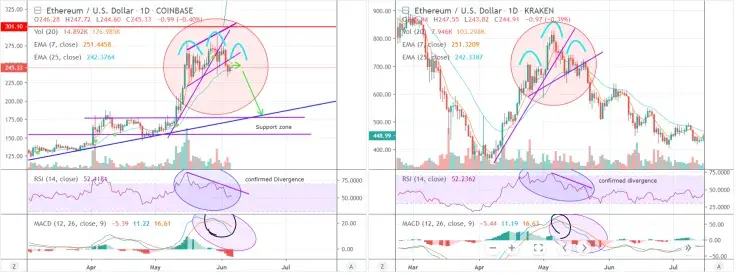
Recently, ETH was at a crossroads. That it was either forming a massive bull flag to rally more, or it was going to break down past the channel. At this point, ETH has broken down past the channel. This is not a good sign, any buying momentum has dried up. Even with ETH/BTC getting a little bit of upward movement, it still has failed to make any significant progress to the upside. All in all, in the near term this does not appear to bode well for a significant move up in ETH/USD.
RSI has also confirmed divergence and MACD has crossed and is slowing down. Both indicating weakening selling pressure and that more downside is in the cards. Maybe, just maybe we'll move sideways for some time and eventually go back up to the upside. For now, it appears that a retrace is in the cards until we get our large move up to 450. We could potentially go lower than my support zone depending on what happens.
Now, look at the charts: there’s a similar topping pattern, breaking the trendlines. The divergence, the MACD crossover look close. The price even doubled back then from $400 to $800, while price now basically did the same. You can see it did or even more depending on where you measure from. It's time to exercise caution. Now, traders are out of ETH position and will look to rebuy on a dip. See how ETH went from $800 down to $400 again? That might mean we go to the $150-175 support zone.
Next rally is around the corner

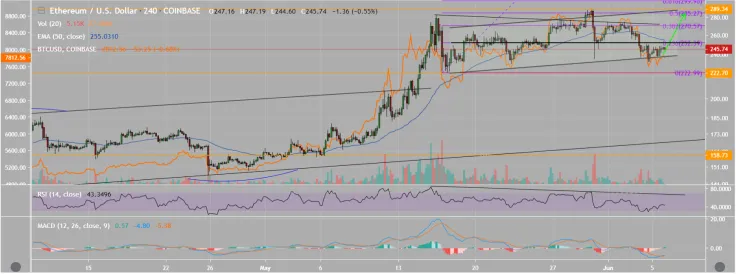
ETH within parallel trend channel is on the lower limit. It’s swinging around fib retracements, shifting it to the ending point of correction. RSI has been in negative trend since May 16th – but ETH built a new (double) top on May 31st – correction has been necessary to close the negative divergence.
Now, we’re expecting ETH to break through resistance (fib 23.6% / 252$) and rising to fib 50%, which also is the upper limit of trend channel (285$) and an existing swing trend line: resulting benefits: ~ 16%.
If ETH continues to follow the move of BTC (supposed a rally take part at BTC ), the rise could last on and prices around 365$ are coming in sight – on that level, ETH reaches a fib retracement resulting from the big correction in 2018. On a daily basis, the indicators are still negative, while on the 4h basis, indicators have turned up.
ETH in Cup & Handle

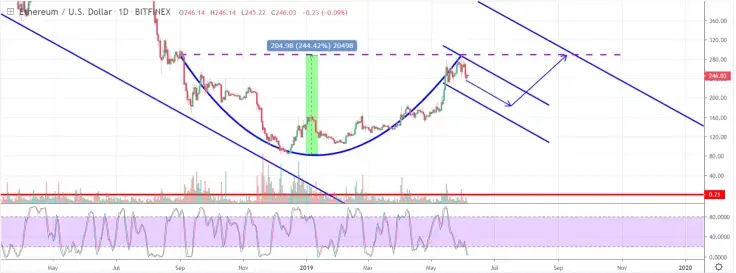
Look at the chart from VictorSoares: see the cup & handle forming? If this pattern validates, we might see Ethereum plummeting to $175-180 and going up again.
Final thoughts
Afraid of Ethereum’s drop? Look at the bright side: it must soar again even after touching some $175-180 point. Thus, it’s not time to panic-sell! Better hold your assets for higher profits!
Ethereum price charts by TradingView

 Alex Dovbnya
 Dan Burgin