
Disclaimer: The opinions expressed by our writers are their own and do not represent the views of U.Today. The financial and market information provided on U.Today is intended for informational purposes only. U.Today is not liable for any financial losses incurred while trading cryptocurrencies. Conduct your own research by contacting financial experts before making any investment decisions. We believe that all content is accurate as of the date of publication, but certain offers mentioned may no longer be available.
Dogecoin (DOGE), the eighth largest cryptocurrency by market capitalization, is in an intriguing spot with technical indicators creating a mixed outlook for its price.
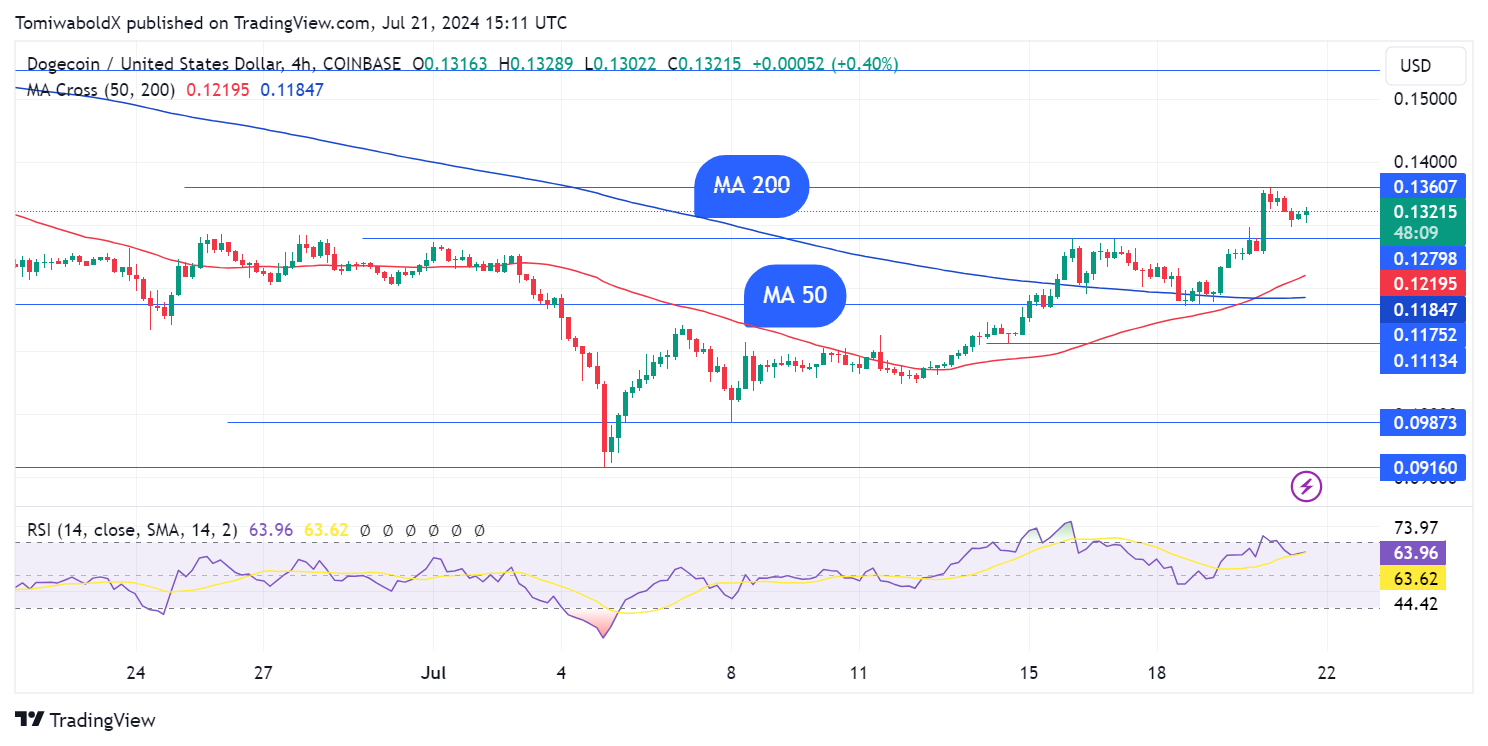
While a death cross has emerged on the daily charts, signaling potential bearish momentum, the hourly charts tell a different story, with a golden cross appearing on the four-hour chart.
In technical analysis, a death cross occurs when a short-term moving average such as the moving average (MA) 50 crosses below a long-term moving average such as the MA 200. This pattern is commonly interpreted as a bearish signal, signaling potential price declines.
On the other hand, a golden cross occurs when a short-term moving average crosses above a long-term moving average, often interpreted as a bullish signal suggesting upward price movement.

Dogecoin's daily chart recently displayed a death cross, as the 50-day moving average has fallen below the 200-day moving average. Despite the bearish outlook on the daily chart, Dogecoin's four-hour chart paints a different picture. A "golden cross" has formed, with the MA crossing above the MA 200. This suggests that, in the very short term, Dogecoin may experience a price climb.

Currently, Dogecoin is seeing a price rebound after declining for five days in a row. At the time of writing, Dogecoin was up 3.03% in the last 24 hours to $0.132.
Implications
Dogecoin's current technical indicators present an intriguing narrative. The death cross on the daily chart suggests caution, while the golden cross on the four-hour chart offers a glimmer of hope for bullish traders.
The emergence of both the death cross and the golden cross on two different time frames reflects the mixed sentiment in the market, that of caution and optimism.

Some traders regard moving average (MA) crosses as lagging indicators, which frequently coincide with trend exhaustion and trap investors on the wrong side of the market. MA studies frequently rely on historical data and tend to lag prices. For instance, a death cross could indicate the bottom of a bear market.
This divergence, as seen for the Dogecoin price, suggesting a mixed outlook, highlights the importance of considering multiple time frames when analyzing the market.
 Dan Burgin
 U.Today Editorial Team