Disclaimer: The opinions expressed by our writers are their own and do not represent the views of U.Today. The financial and market information provided on U.Today is intended for informational purposes only. U.Today is not liable for any financial losses incurred while trading cryptocurrencies. Conduct your own research by contacting financial experts before making any investment decisions. We believe that all content is accurate as of the date of publication, but certain offers mentioned may no longer be available.
Cardano, as indicated by its recent price action, formed a converging triangle pattern commonly known as a symmetrical triangle on its daily chart. This pattern is often a harbinger of a significant price movement, signaling consolidation as the token's price converges to a point. For ADA, the anticipation of a breakthrough is palpable.
The symmetrical triangle shows that the highs and the lows are converging toward each other, creating a sense of equilibrium between buyers and sellers. Typically, this pattern suggests a breakout is imminent. The direction of the breakout, however, remains uncertain until it occurs, as symmetrical triangles can herald both bullish and bearish outcomes.
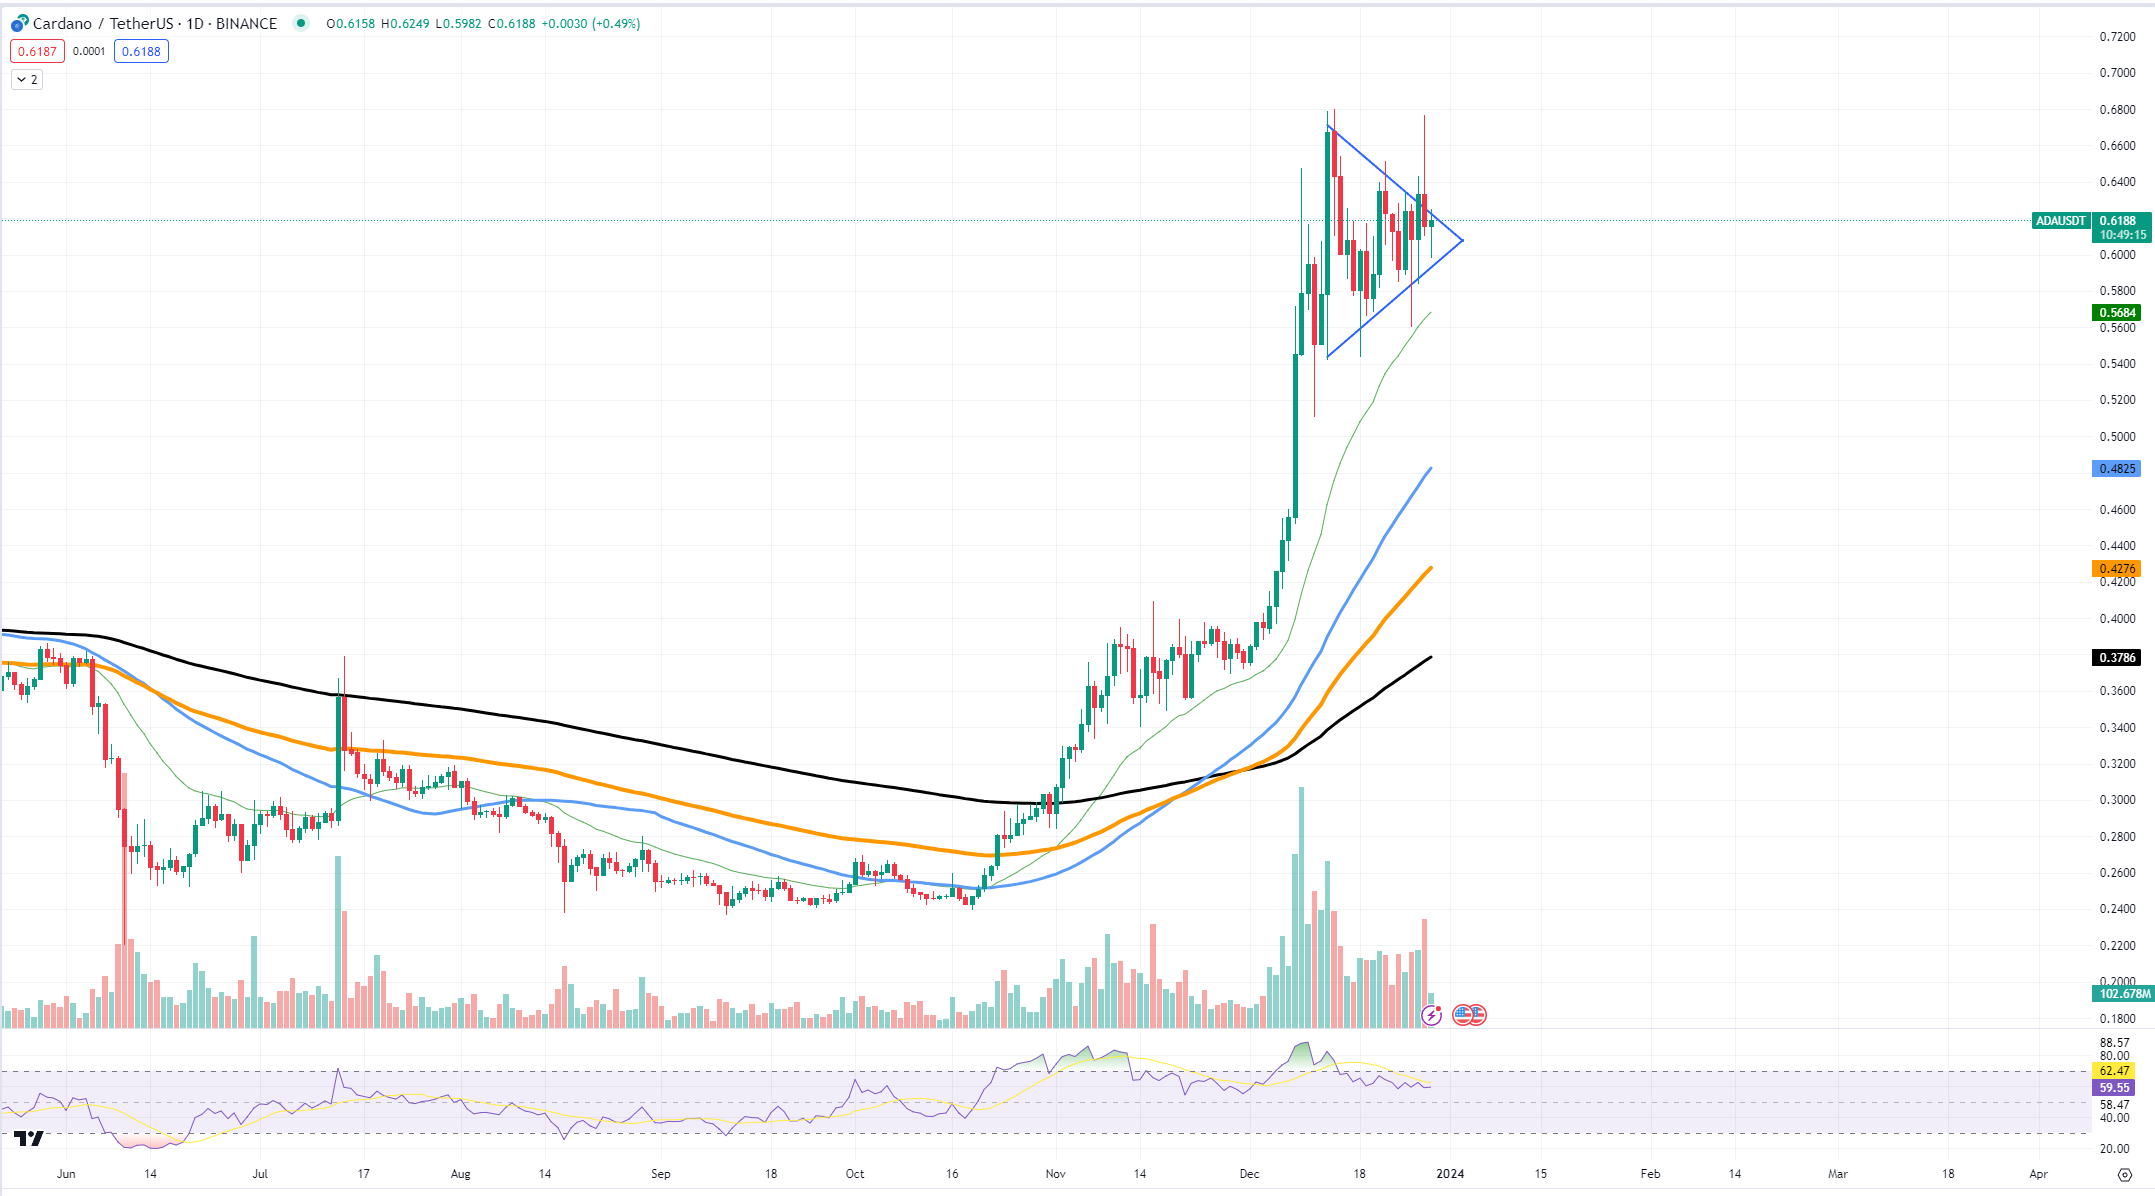
In ADA's case, the pattern formed after a period of an uptrend, which could potentially make a bullish breakout more likely. If ADA manages to break through the upper trendline of the triangle with substantial volume, this could be the catalyst for a massive rally. The moving averages, which appear to be aligned below the current price level, add to the bullish narrative by acting as potential support zones that could fuel upward momentum.
If ADA breaks out of the triangle, it could signal a bearish continuation, potentially erasing recent gains. This bearish scenario would require a reassessment of support levels and could lead to a more cautious approach from market participants.
Two continuation scenarios emerge from this critical setup:
Bullish breakout: A decisive close above the triangle's upper boundary could ignite a rally, propelling ADA to test previous resistance levels. Traders might look for increased volume as a confirmation of the breakout's sustainability. This move could attract new buyers, reinforcing the upward trend.
Bearish turnaround: Conversely, if ADA breaks below the triangle, it may suggest that the rally was losing steam, and a bearish phase is beginning. Traders might then set their sights on lower support levels to gauge potential buy-in points for a longer-term hold or to manage their stop-loss strategies effectively.
In both scenarios, the Relative Strength Index is a critical indicator to watch. Currently hovering around the midpoint, it does not indicate overbought or oversold conditions, leaving room for movement in either direction.
For ADA holders and potential investors, the outcome of this triangle pattern holds significant weight. It represents not just a technical milestone, but also a reflection of underlying market sentiment toward Cardano's progress and potential in the ever-evolving blockchain landscape. As the situation unfolds, staying attuned to the chart developments and volume indicators will be key to navigating the waters of this potential breakout.
BONK is trying to come back
Bonk has made a less expected move recently. The asset has seen an 11% surge in its price over the last 24 hours, catching the attention of traders and Meme coin enthusiasts alike.
This recent jump could be attributed to a phenomenon known as a "dead cat bounce," a temporary recovery from a prolonged decline or a bear market that is followed by the continuation of the downtrend.
Investors should be cautious, as such spikes can often be misconstrued as reversals of a bearish trend. In the case of BONK, the token's history of extreme volatility calls for a prudent approach to investment, especially when considering the broader category of meme coins on the Solana network.
The rise of BONK has parallels to Shiba Inu's explosive cycle, with both tokens capturing the zeitgeist of their respective moments in the cryptosphere. BONK's ascent has been fueled in part by a widely distributed airdrop, which helped catapult its visibility and trading volume. This strategy of mass distribution has historically been effective in generating hype and a flurry of activity around a token, albeit often accompanied by significant price fluctuations.
Shiba Inu's rise was marked by extreme volatility, and its significant gains were not sustained over the long term. BONK's current trajectory could follow a similar pattern, with initial excitement potentially leading to sharp corrections. The comparison to Shiba Inu suggests that while BONK may be enjoying its moment in the spotlight, the token's inherent instability makes it a risky bet for investors seeking sustainable growth.
 Dan Burgin