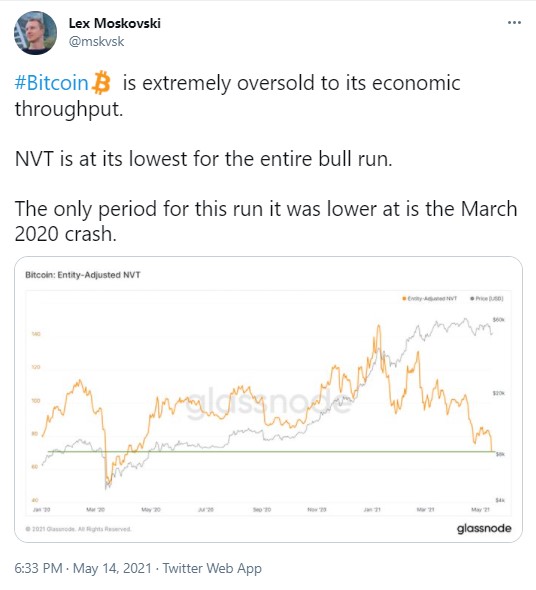
Chart provided by popular analytics platform Glassnode shows that Bitcoin NVT (Network Value to Transactions) Ratio has been at the lowest point during the entire BTC rally that began in October last year and continued in January, pushing Bitcoin first above the $20,000 level and the driving it on to $40,000 and then $64,000 zone.
Bitcoin NVT can be calculated by dividing the network value (market capitalization) by the volume of USD transferred on the BTC blockchain per day and it shows if Bitcoin is overbought or oversold.
As per the chart, BTC NVT is almost as low as it was in March last year, when the Black Thursday took place, pushing equity and crypto markets deep down.
Back then, Bitcoin lost 50 percent in one day and plunging below the $4,000 level. Crude oil quotes plummeted below zero.
The current low level of Bitcoin NVT clearly demonstrates that the king crypto is very much oversold.


 Arman Shirinyan
 Alex Dovbnya
 Dan Burgin
 Gamza Khanzadaev