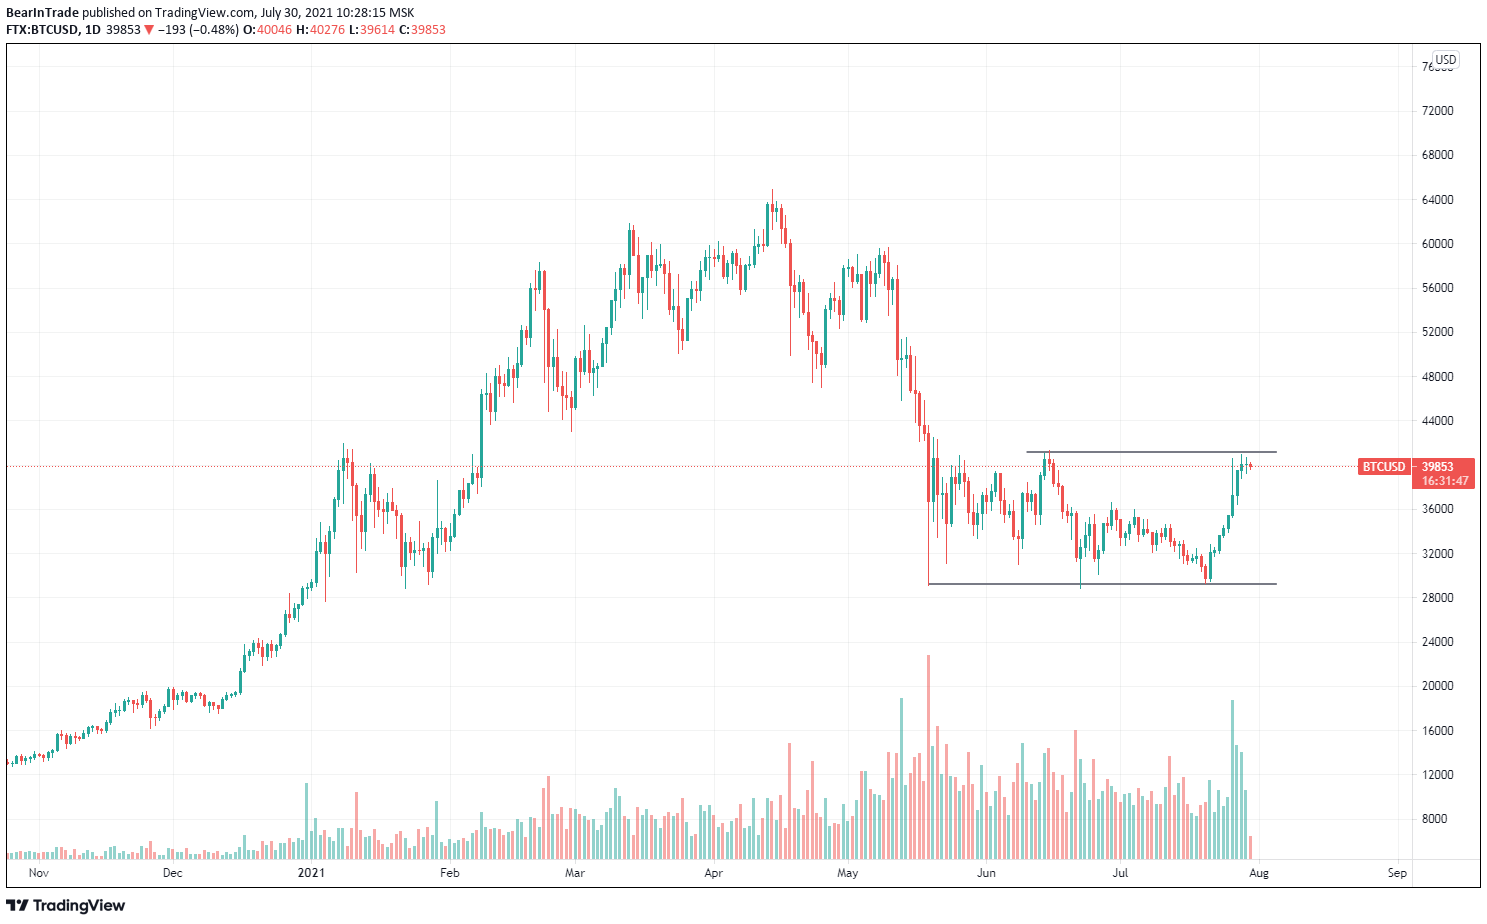
Bitcoin's current price action suggests that recent growth is currently slowing down with on-chain data from Glassnode and blockchain.com.
First of all, the daily Bitcoin chart shows us that growth momentum is currently slowing down after an eight-day increase. The latest major Bitcoin move took place on July 27 with 8.7 percent growth.

Currently, Bitcoin has failed to get through the $41,100 price resistance. At the same time, the chart suggests that we are seeing a progressive decrease in volumes.
Trading volume on Bitcoin exchanges has returned back to the values of July 26.
In addition to decreased volumes, we currently see a slow decrease in wallet activity data, suggesting that Bitcoin holders and traders are currently not moving their funds.
Previously, various analysts have expressed their feelings about the current market situation. They have agreed on the fact that Bitcoin must gain a foothold above $40,000 to regain bullish momentum and start moving further to the new ATH.
Bitcoin was struggling to get through a strong 200-day moving average resistance line on the chart multiple times. Experts have agreed that, if the price goes below the $40,000 price mark and 200-day moving average, we would see a new downward movement.
 Vladislav Sopov
 Dan Burgin