Disclaimer: The opinions expressed by our writers are their own and do not represent the views of U.Today. The financial and market information provided on U.Today is intended for informational purposes only. U.Today is not liable for any financial losses incurred while trading cryptocurrencies. Conduct your own research by contacting financial experts before making any investment decisions. We believe that all content is accurate as of the date of publication, but certain offers mentioned may no longer be available.
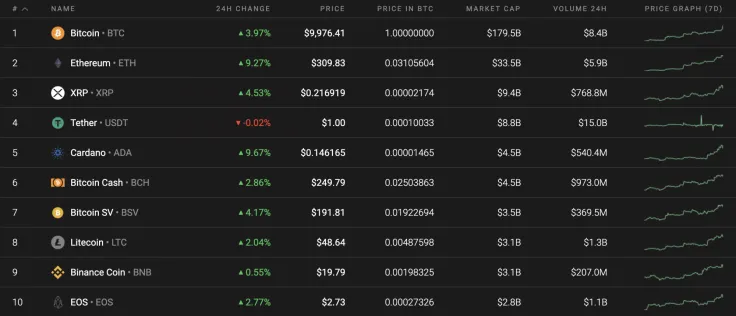
Bitcoin (BTC) and all the other coins from the Top 10 list have maintained their growth since the beginning of the week. Today, however, Bitcoin (BTC) blasted above the $10,000 mark, while the altcoins have not shown signs of huge growth.
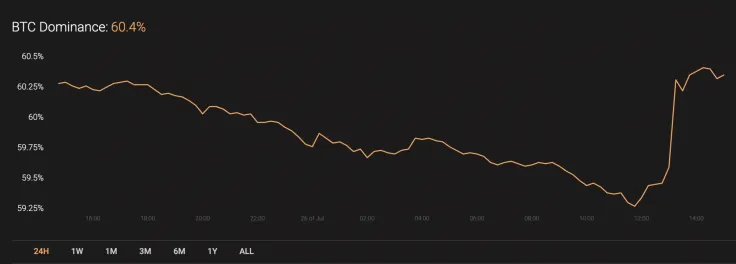
The dominance rate for Bitcoin (BTC) has bounced off after rocketing towards the $10,000 mark. The current index sits at 60.4%.
Below is the relevant data for Bitcoin (BTC) and how it's looking today:
-
Name: Bitcoin
Advertisement -
Ticker: BTC
-
Market Cap: $184,021,609,192
-
Price: $9,977.87
Advertisement -
Volume (24H): $21,545,007,250
-
Change (24H): 3.90%
The data was relevant at press time.
BTC/USD: What Are the Chances of Fixing Above $10,000 Now?
Bitcoin (BTC) has been trending upwards for the week; however, there was sharp growth for BTC today when it reached almost reached the $10,300 mark. Meanwhile, the uptick from the last 7 days has constituted a rate increase of 8.28%.
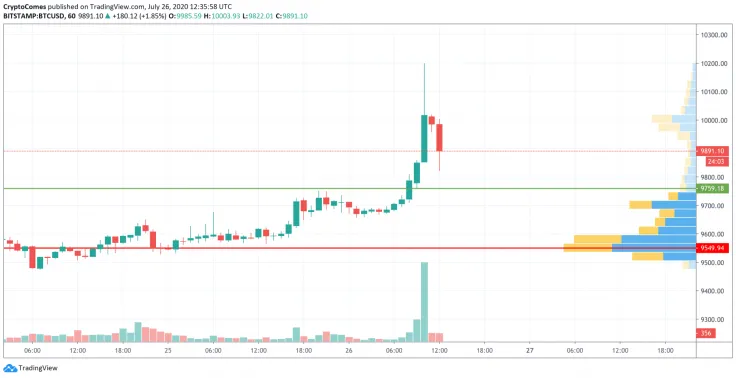
Bitcoin (BTC) has entered a correction phase on the hourly chart. Bitcoin's trading volume and the liquidity are at their lowest levels, which means that the decline might not yet have stopped. The closest level where buyers may show any resistance is the so-called 'mirror' level around the $9,750 mark. If the bears push below the aforementioned mark, then the bullish scenario will be cancelled.
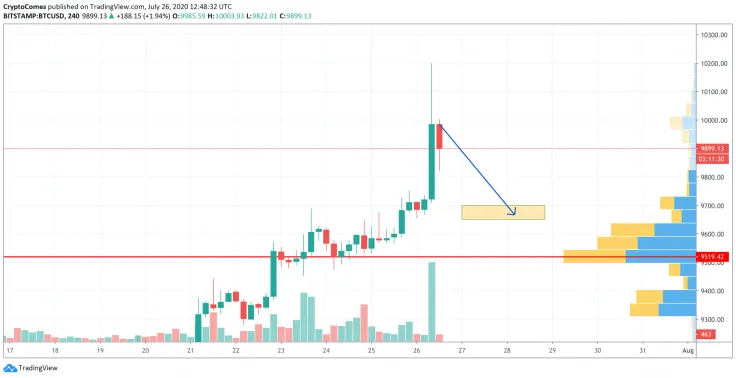
Looking at the 4H chart, the situation is similar as the bears have seized on the initiative as Bitcoin (BTC) could not fix above the $10,000 mark. At this candle, there was a sharp rise in the trading volume, which usually happens at the last wave of a rise. At the moment, the bulls need to maintain growth between the $9,650-$9,700 range, which may be the end of the correction. This forecast is relevant for the next few days.
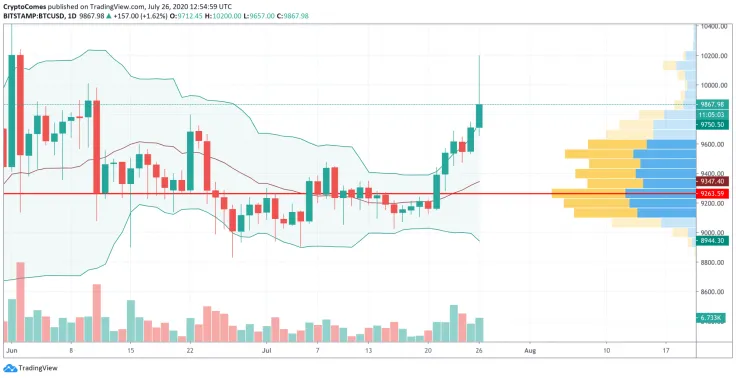
Looking at the bigger time frame, the current price blast happened as a result of an accumulation period, which lasted for a few days. What is more, the trading volume has been constantly on the rise. At the moment, traders need to pay close attention to the basic line of the Bollinger Bands, which is located around the $9,350 mark. If the bulls bounce off this level, then the rise will likely continue.
At press time, Bitcoin was trading at $9,884.
 Dan Burgin
 U.Today Editorial Team