Disclaimer: The opinions expressed by our writers are their own and do not represent the views of U.Today. The financial and market information provided on U.Today is intended for informational purposes only. U.Today is not liable for any financial losses incurred while trading cryptocurrencies. Conduct your own research by contacting financial experts before making any investment decisions. We believe that all content is accurate as of the date of publication, but certain offers mentioned may no longer be available.
Despite the bloodbath that took place on the "streets" of the crypto market, it seems that this local bear market is far from over. At least that is what the Bollinger Bands for the third largest cryptocurrency, XRP, indicate.
Looking at the price chart of the token on the daily time frame, it can be seen that after XRP spiked 34.27% on Sunday, the price of the token finally hit an upper band.
What happened next is that the price of XRP went straight down from that upper band and broke the middle curve at $2.50. And we are talking about the daily time frame, which only solidifies the behavior within the Bollinger Bands. With the lower band currently stretched at $2.04, the bias is to test buyers' reaction and sellers' strength there.
Right now, the price of XRP is quoted at $2.32, so the drop to $2.04 will mean another 11% move south.
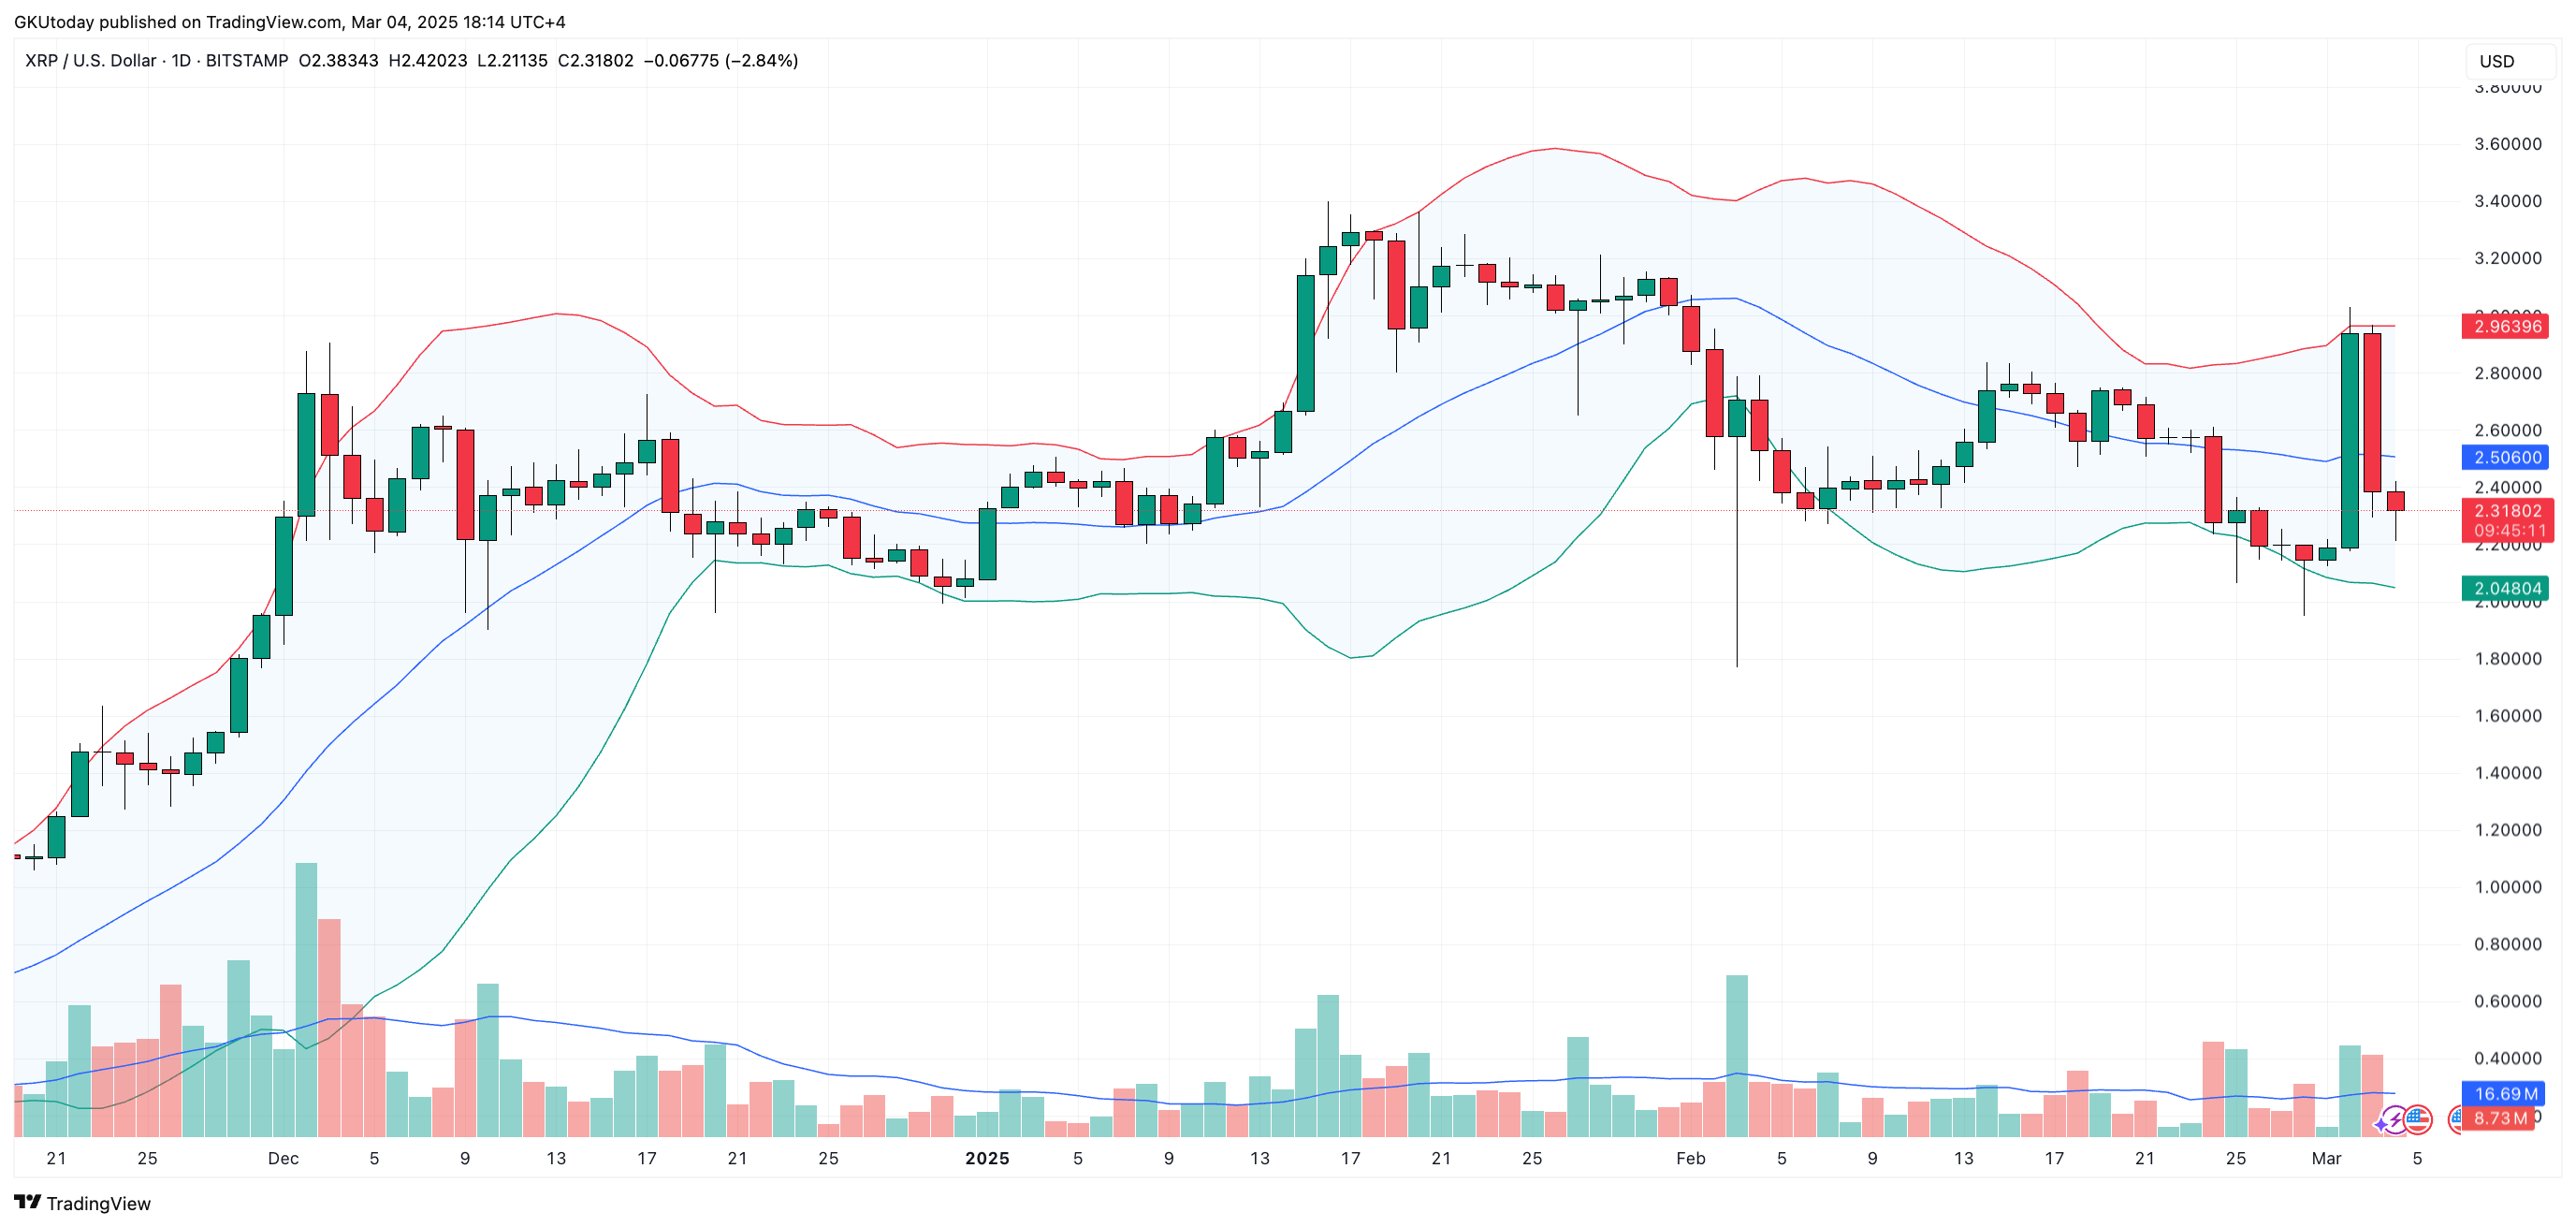
The Bollinger Bands are like magnets, pulling price action in all sorts of directions. On Sunday, the upper Bollinger Band might have triggered some profit-taking or panic-selling once the momentum stalled.
But the question remains: Is XRP's price headed for a brief dip or a more extended period of consolidation?
We cannot predict the future, but we can manage risk. Right now, it looks like the market might be testing the lower Bollinger Band. Traders should be ready for some volatility and a lot of unpredictability in the short term.
 Dan Burgin
 U.Today Editorial Team