Disclaimer: The opinions expressed by our writers are their own and do not represent the views of U.Today. The financial and market information provided on U.Today is intended for informational purposes only. U.Today is not liable for any financial losses incurred while trading cryptocurrencies. Conduct your own research by contacting financial experts before making any investment decisions. We believe that all content is accurate as of the date of publication, but certain offers mentioned may no longer be available.
The popular cryptocurrency XRP is currently at a crossroads in terms of its price trajectory, as shown by the Bollinger Bands, a widely used technical indicator developed by John Bollinger. With XRP currently trading at $0.54 per coin, it has broken through the lower boundary of the dynamic price range as defined by the indicator.
Bollinger Bands are made up of a middle line, which is usually a moving average, and two bands that sit at a certain number of standard deviations above and below this line. When the price of an asset moves outside the bands, it can be seen as a sign that the current trend might be continuing, or a reversal is somewhere very near.

When the price breaks below the lower band, as XRP did, it means that the asset is oversold and traders are likely to look for a rebound or further decline.
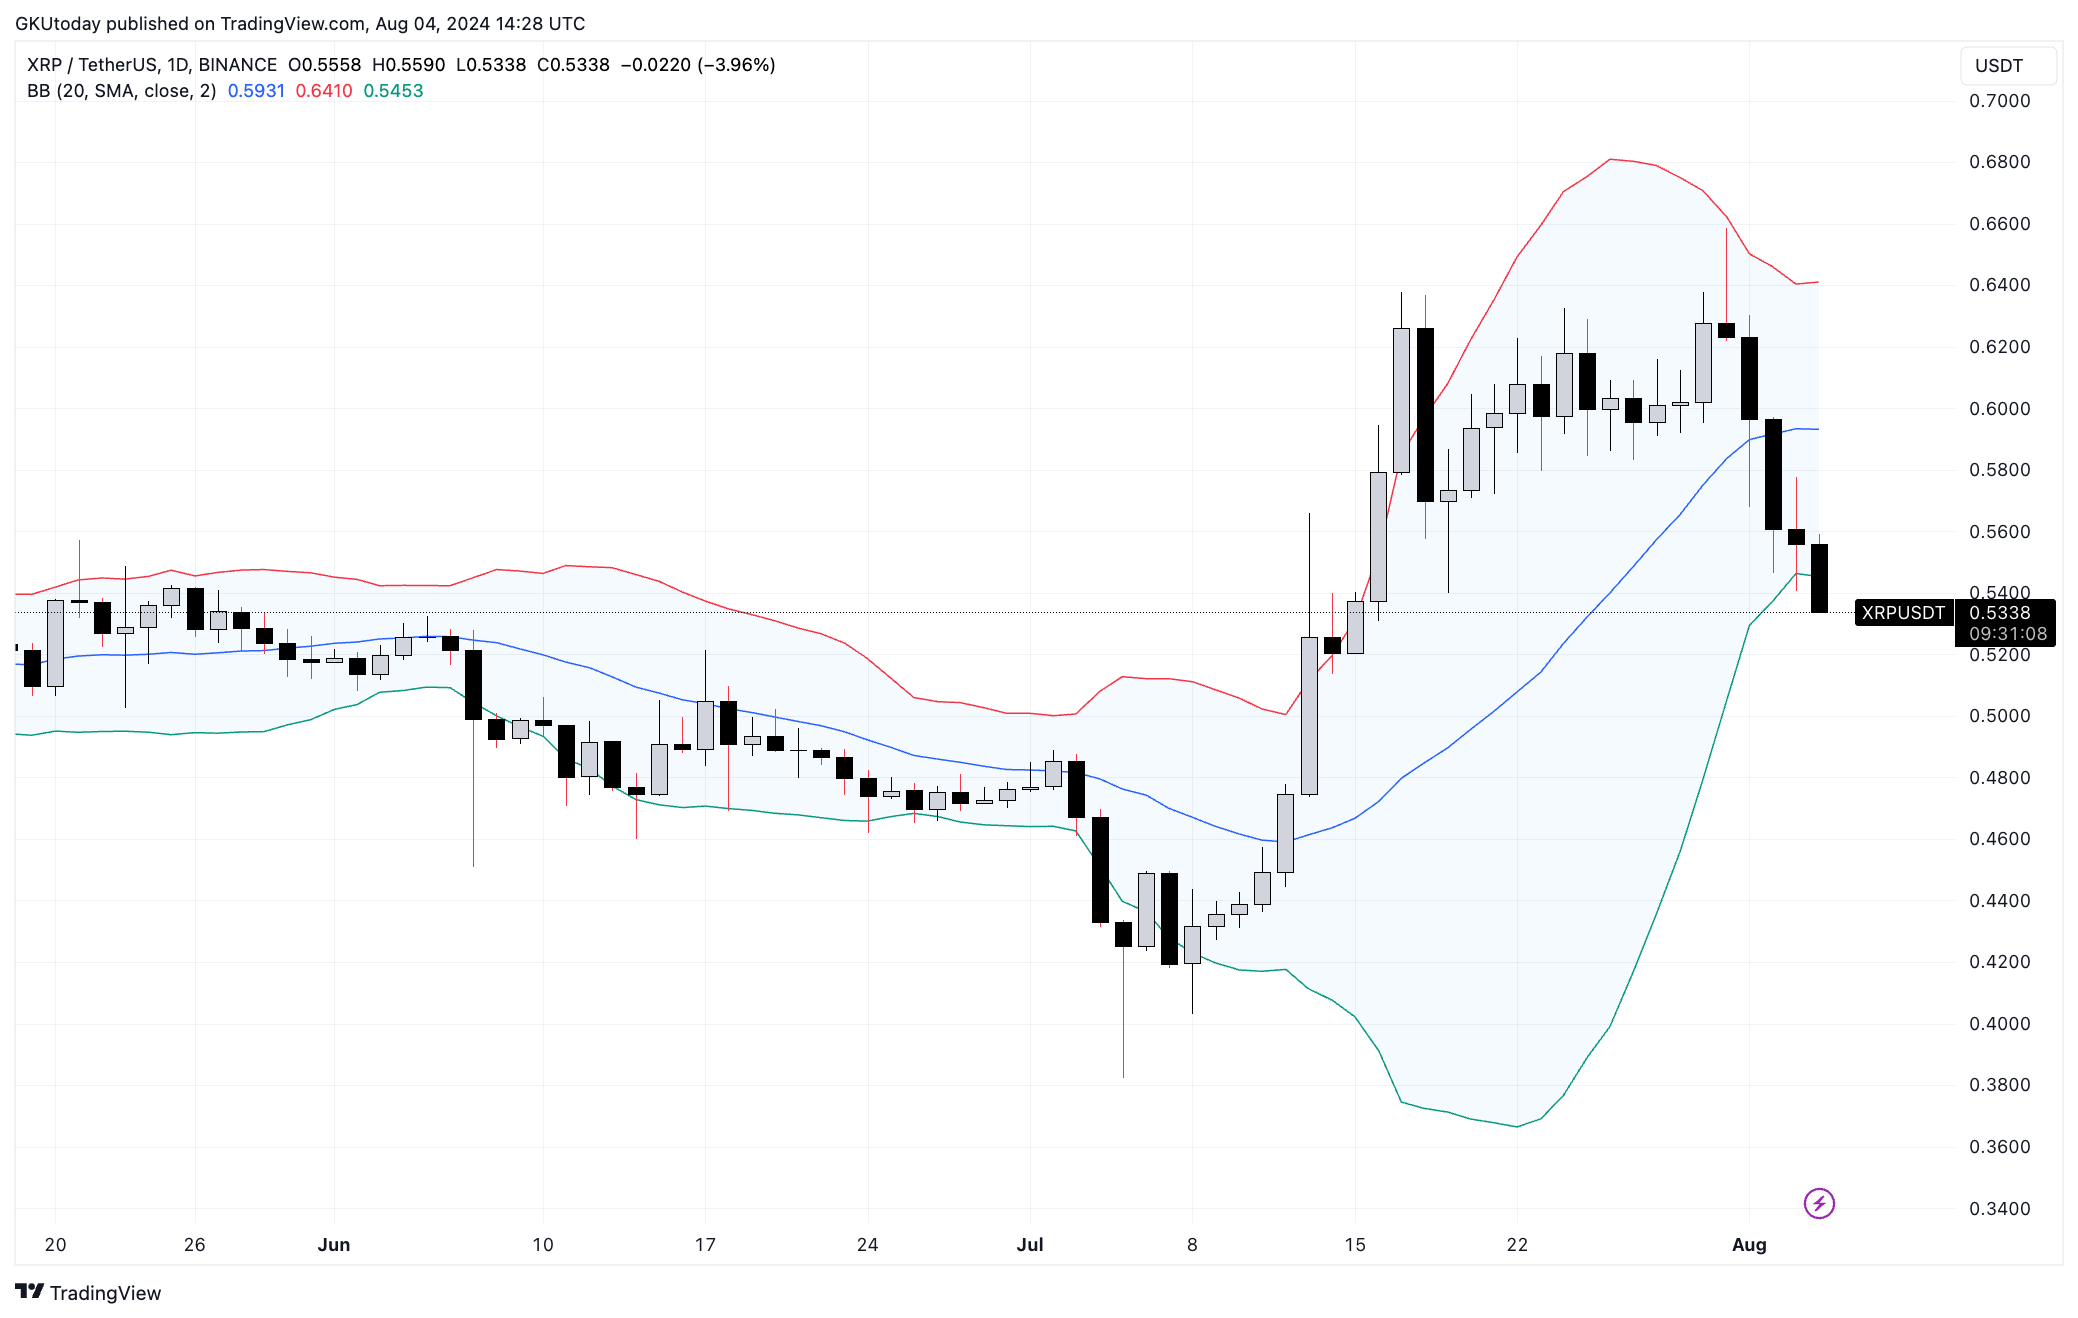
As such, XRP's price action at the moment is indicative of extremely bearish sentiment among traders toward one of the market's largest assets.
Two scenarios
The last time something like this happened was in early July, when XRP fell 11% intraday, only to bounce back between bands.

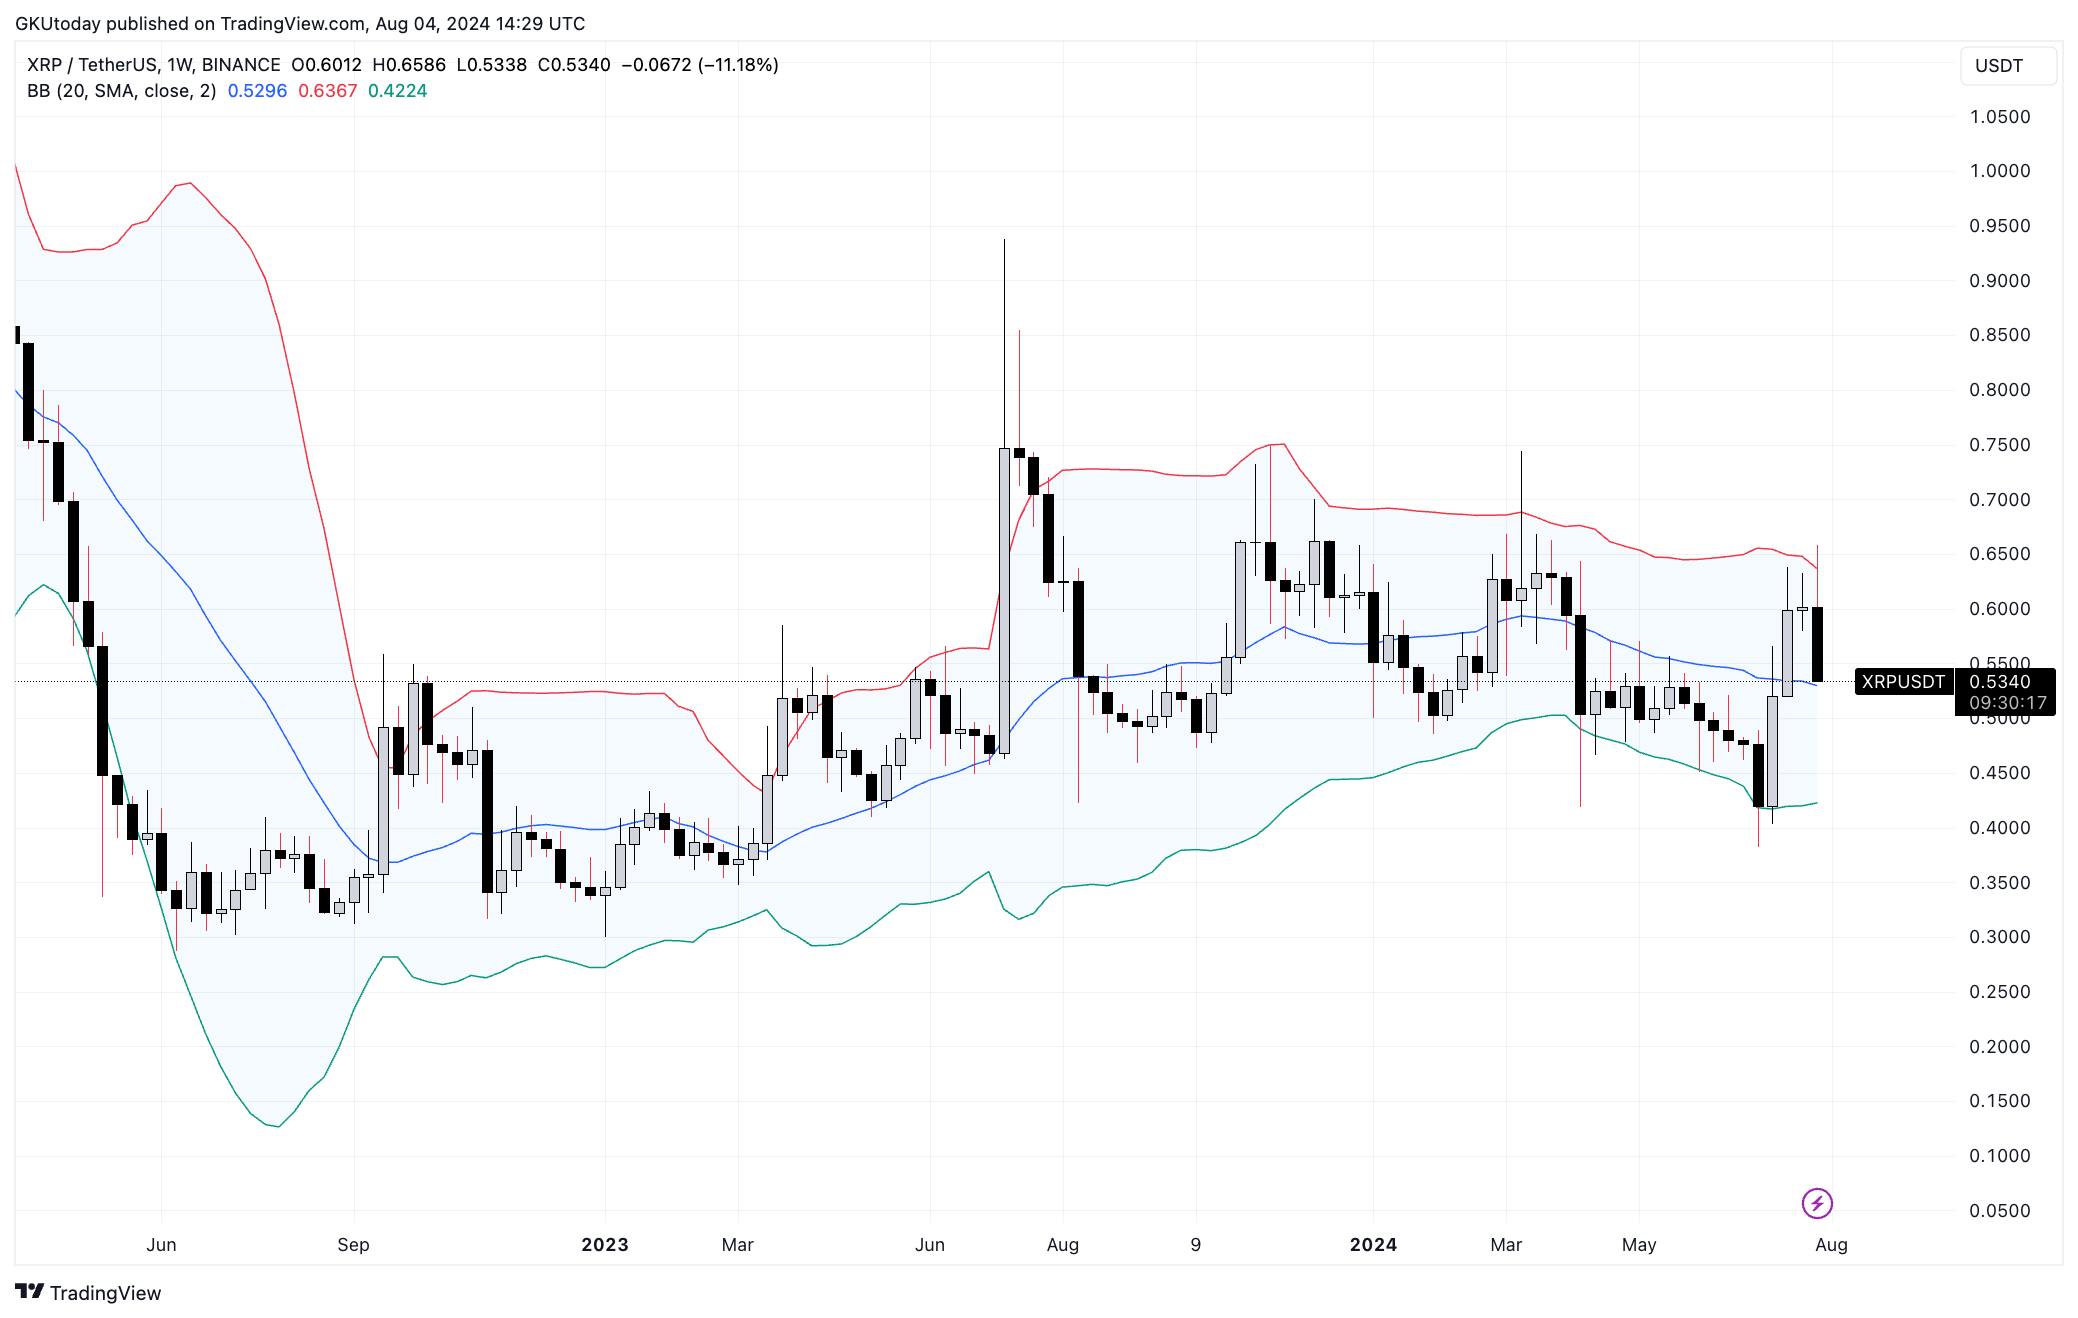
On the weekly chart, however, XRP is still within the range and is about to retest the midline. So, if we try to outline scenarios based on this chart, we have the next picture. If XRP fails to hold $0.53, it could fall further to around $0.42. If $0.53 is held and maintained, then the bias is to go to $0.64.
 Dan Burgin
 U.Today Editorial Team