Disclaimer: The opinions expressed by our writers are their own and do not represent the views of U.Today. The financial and market information provided on U.Today is intended for informational purposes only. U.Today is not liable for any financial losses incurred while trading cryptocurrencies. Conduct your own research by contacting financial experts before making any investment decisions. We believe that all content is accurate as of the date of publication, but certain offers mentioned may no longer be available.
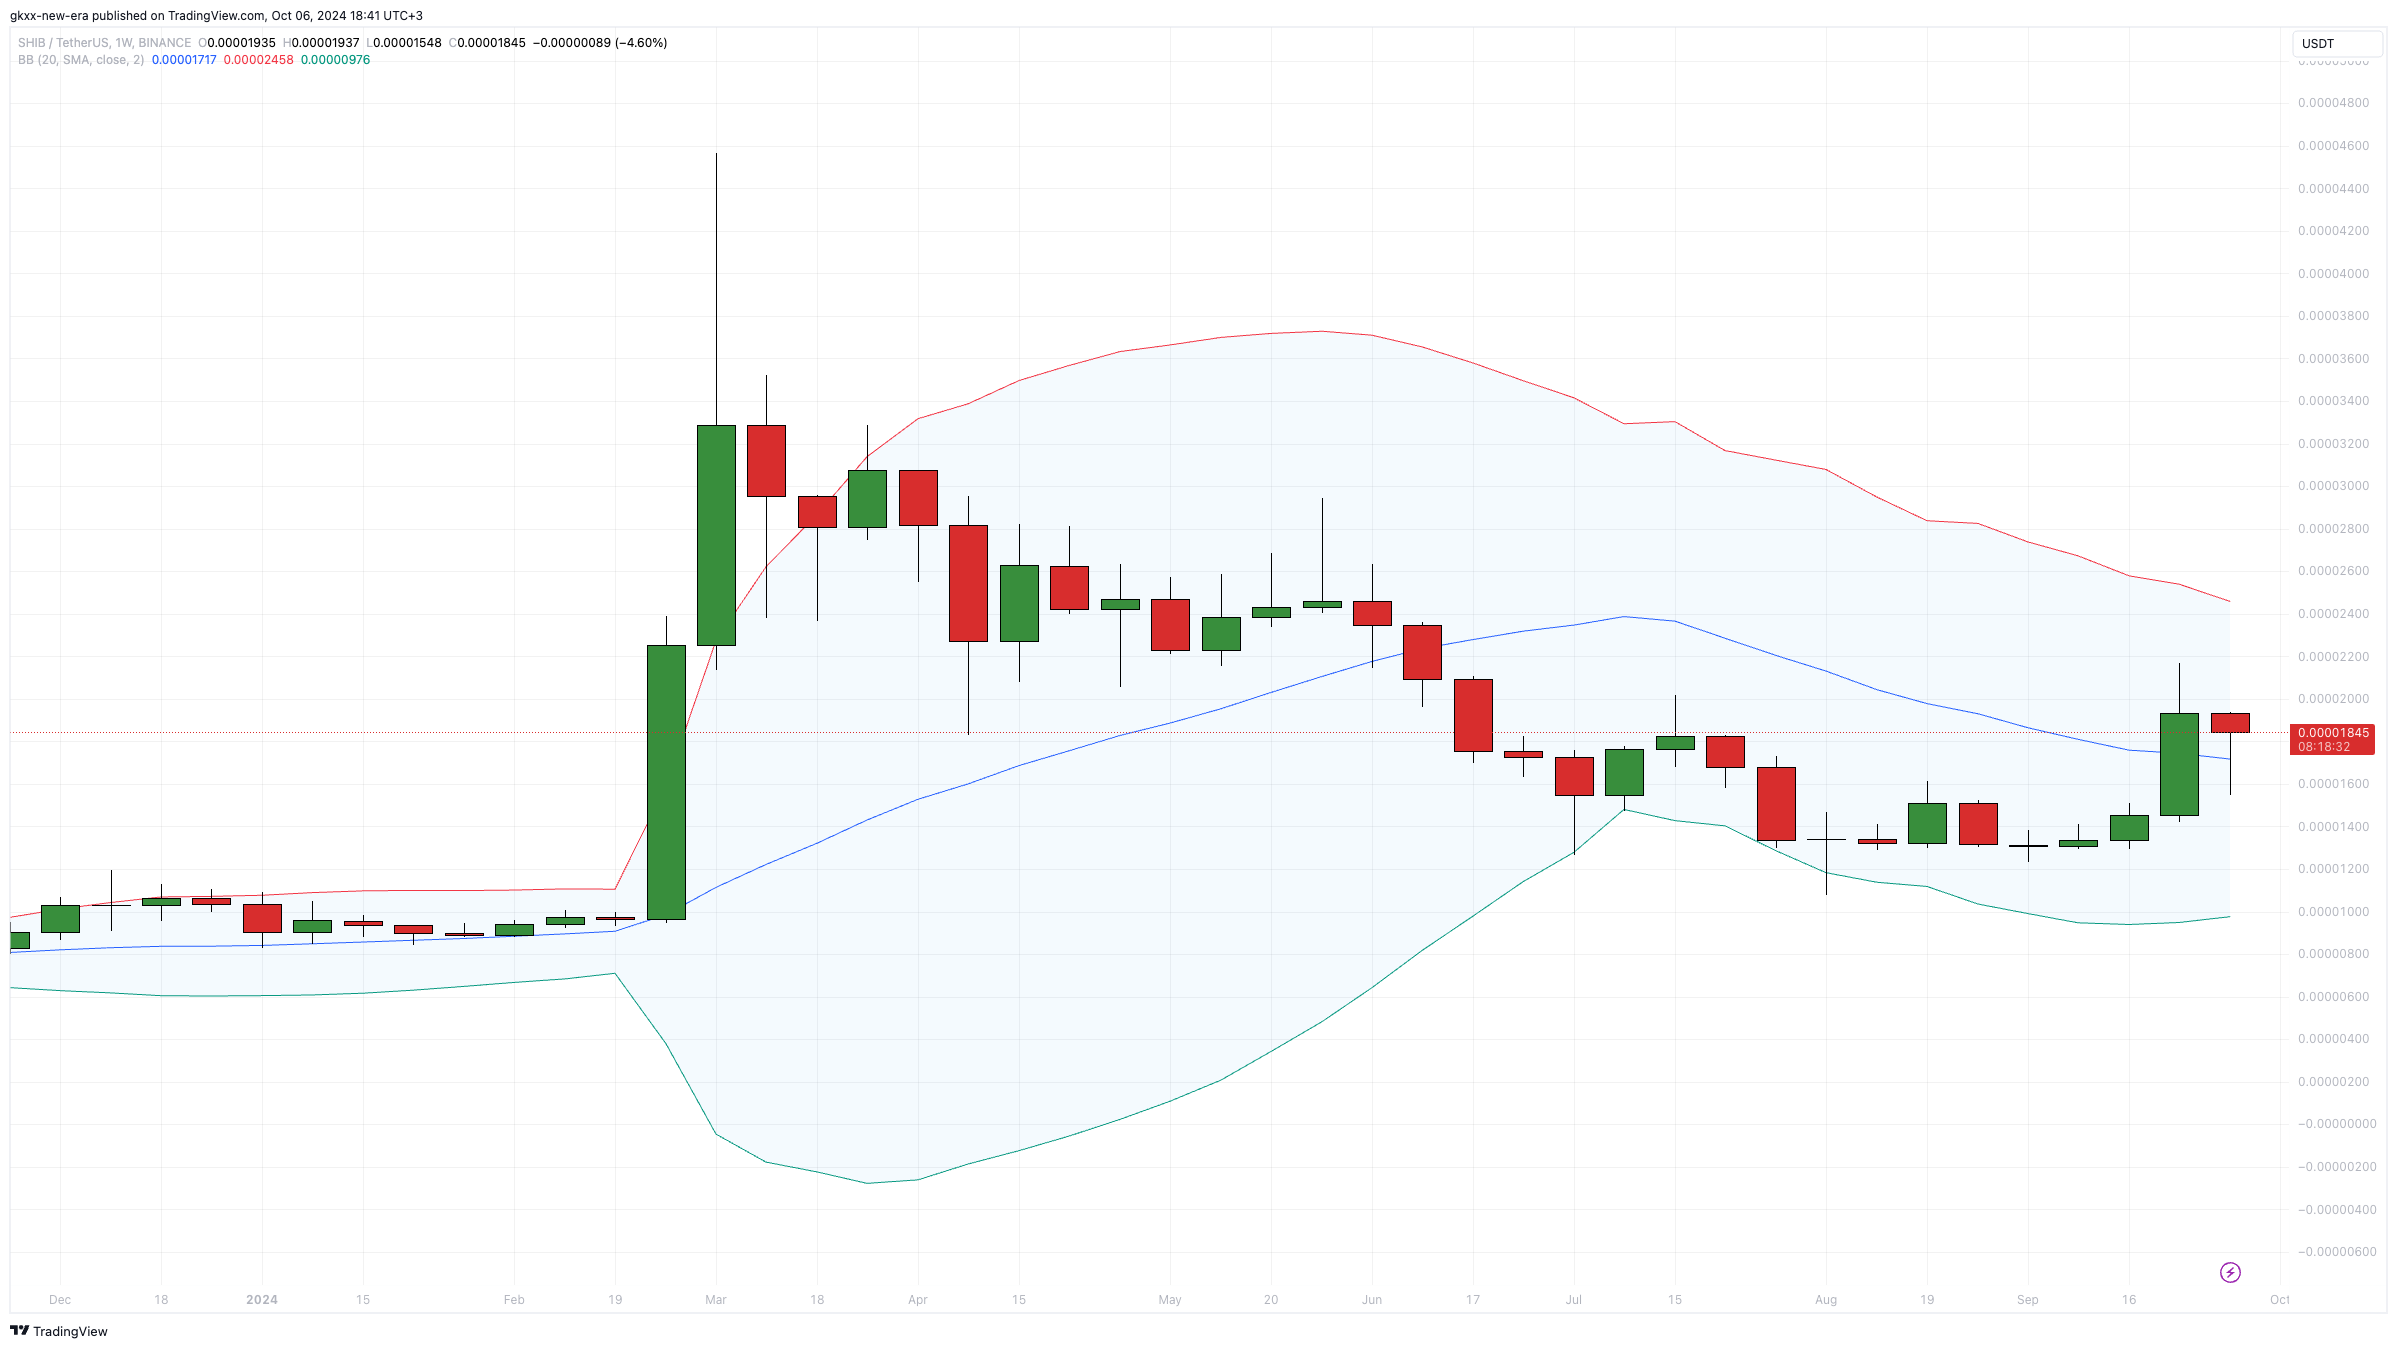
The popular meme-inspired cryptocurrency Shiba Inu (SHIB) is closing the current week on a bullish note, as signaled by the Bollinger Bands indicator. Developed and named after its creator, John Bollinger, the indicator represents two dynamic lines of average maximum and minimum asset prices and the average, forming a full-fledged range.
Price movement and behavior within this range can help traders make investment decisions, including when abnormal compressions and contractions occur, or when the price moves outside one of the bands.
In our case, nothing particularly global happened, but a hidden signal was given. Thus, the price of the Shiba Inu token, despite the fact that it lost 5.84% this week, managed to go above the average of the bands, which in itself indicates the strength of buyers or bulls in the asset, and if the weekly candle is fixed above this level, it will be a great help for SHIB.

Shiba Inu (SHIB) price: 2 main scenarios right now
If Sunday ends with the price of the Shiba Inu token above $0.00001714, it will be open to $0.00002456, which would mean another 26.5% move to where the upper Bollinger Band is now. This scenario also fits with the logic that this week was a correction to last week's retracement, which saw SHIB rise 33.2%.
Of course, these are just probabilities and theories. If the price of the meme token is destined to fall, then the lower boundary of the range on the indicator is now at $0.0000098.


 Godfrey Benjamin
 Arman Shirinyan
 Yuri Molchan
 Alex Dovbnya