Disclaimer: The opinions expressed by our writers are their own and do not represent the views of U.Today. The financial and market information provided on U.Today is intended for informational purposes only. U.Today is not liable for any financial losses incurred while trading cryptocurrencies. Conduct your own research by contacting financial experts before making any investment decisions. We believe that all content is accurate as of the date of publication, but certain offers mentioned may no longer be available.
The bearish sentiment began to appear among some of the coins during the second half of the day. This was apparently mostly with Bitcoin Cash (BCH) and Bitcoin SV (BSV), which have dropped 0.29% and 0.48% respectively.
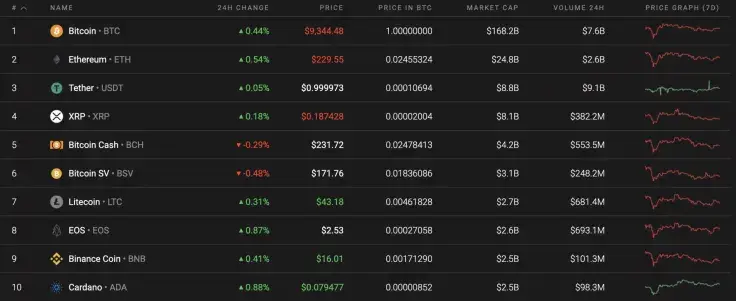
Below is the vital data for Bitcoin (BTC), Ethereum (ETH), and XRP:
|
Name |
Ticker Advertisement
|
Market Cap |
Price |
Volume (24H) Advertisement
|
Change (24H) |
|
Bitcoin |
BTC |
$172,244,619,438 |
$9,355.74 |
$15,425,461,321 |
0.29% |
|
Ethereum |
ETH |
$25,730,807,655 |
$230.89 |
$5,634,764,828 |
0.26% |
|
XRP |
XRP |
$8,297,031,754 |
$0.187470 |
$931,086,575 |
-0.07% |
BTC/USD
Bitcoin (BTC) has been trading between the $9,100-$9,500 range for the last few days. Neither the bulls nor the bears are controlling the situation, which is confirmed by last week's price change. The rate for the main crypto has declined by 0.76% within the last 7 days.
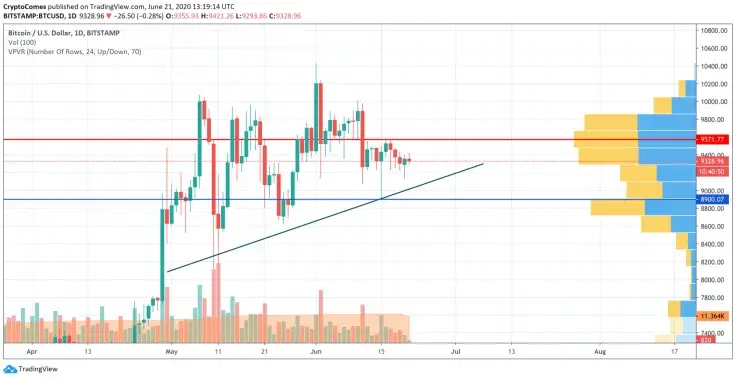
Looking at the daily chart, there are lowering heights, which are confirmed by a decreasing trading volume. It means that the chances of a retest between the $8,900-$9,000 area are quite high. The rising line on the chart serves as a so-called magnet for the leading crypto. Respectively, traders may expect a drop towards the $8,900 mark within the next days.
At press time, Bitcoin was trading at $9,337.
ETH/USD
Ethereum (ETH) is showing better price dynamics since yesterday; however, the leading altcoin has lost 2.31% since last Sunday.
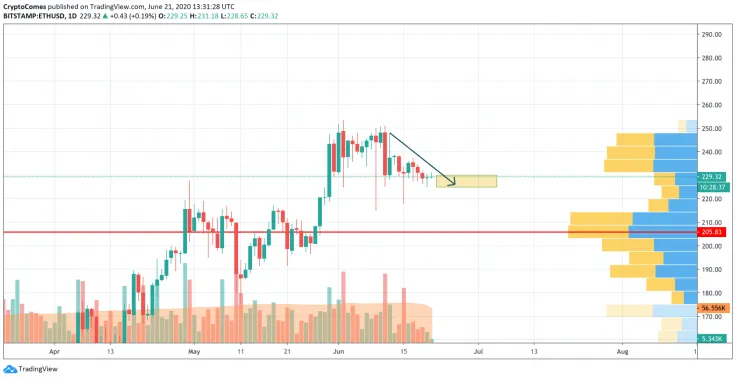
Looking at the daily time frame, Ethereum (ETH) has bounced off its local support level at $225. Currently, the altcoin is trading sideways without any up or down signals. It is too early to consider a correction as the trading volume is not so low, which means that there is buyers' interest at that level. To sum it up, trading between the yellow range of $225-$230 is the most likely price option.
At press time, Ethereum was trading at $229.36.
XRP/USD
XRP is the biggest loser since last week. The price of the coin has declined by 2.56%, while the growth rate has constituted 0.30% since yesterday.
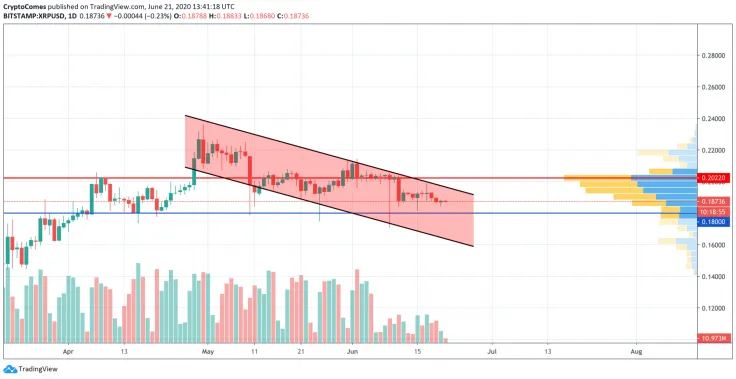
XRP is looking more bearish than Bitcoin (BTC) or Ethereum (ETH). The trading volume continues to decline and there are no buyers to buy back the coin from its current levels. In this particular case, our earlier scenario of a drop to $0.18 remains relevant. If sellers break it, then the rise (since mid-March 2020) will finish.
At press time, XRP was trading at $0.1873.
 Dan Burgin