Ripple (XRP) is a real-time gross settlement system and remittance network, created by Ripple Labs Inc. Ripple’s decentralized network allows for smooth transfer of money, whether it’s fiat or crypto and has partnered with roughly 200 financial institutions and banks across the globe. Its main advantage, and why it is gaining in popularity, is “secure, instantly and nearly free global financial transactions of any size with no chargebacks.”
The native cryptocurrency is XRP, with a total supply of 100 billion, non-minable and used to provide liquidity to payment providers, banks and large corporations that use the Ripple Network. This means that there will tight demand for XRP over the long-term as the network expands.
The two major catalysts this year were when Santander started to use Ripple’s xCurrent network to power their One Pay FX, the first app for international monetary transactions powered by blockchain tech, and when Euro Exim Bank announced it has successfully implemented Ripple’s xRapid. I expect to hear more of the same this year.
Ripple (XRP) Technical Analysis – The Big Picture
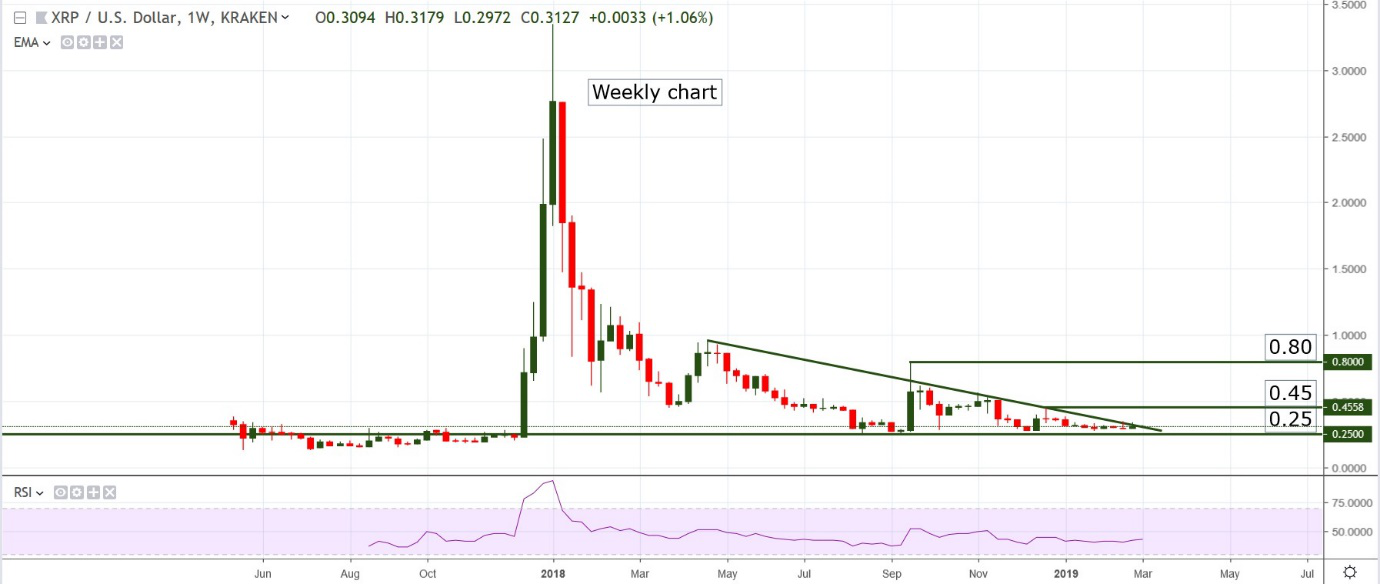
Currently trading at $0.314 Ripple’s XRP is the third cryptocurrency by market cap behind Bitcoin and Ethereum. Its circulating supply of roughly 41 billion is valued at $13,042,248,777 and has been holding steady over the last few months. XRP has been in a downtrend for the past few weeks but the weekly chart shows signs that said trend is exhausted. The last lower low was created late last year, since then the pair has been lingering above $0.25 key support.

In the near term, price is capped by a bearish trend line. Lately, the pair has shown low volatility which opens the door for strong moves to either side. Keep in mind that strong moves which follow a period of low volatility are often reversed, without generating a trend, so be careful until a firm break to either side is made. The main elements to watch on a Weekly chart are the bearish trend line, followed by the resistances at $0.45 and $0.80.

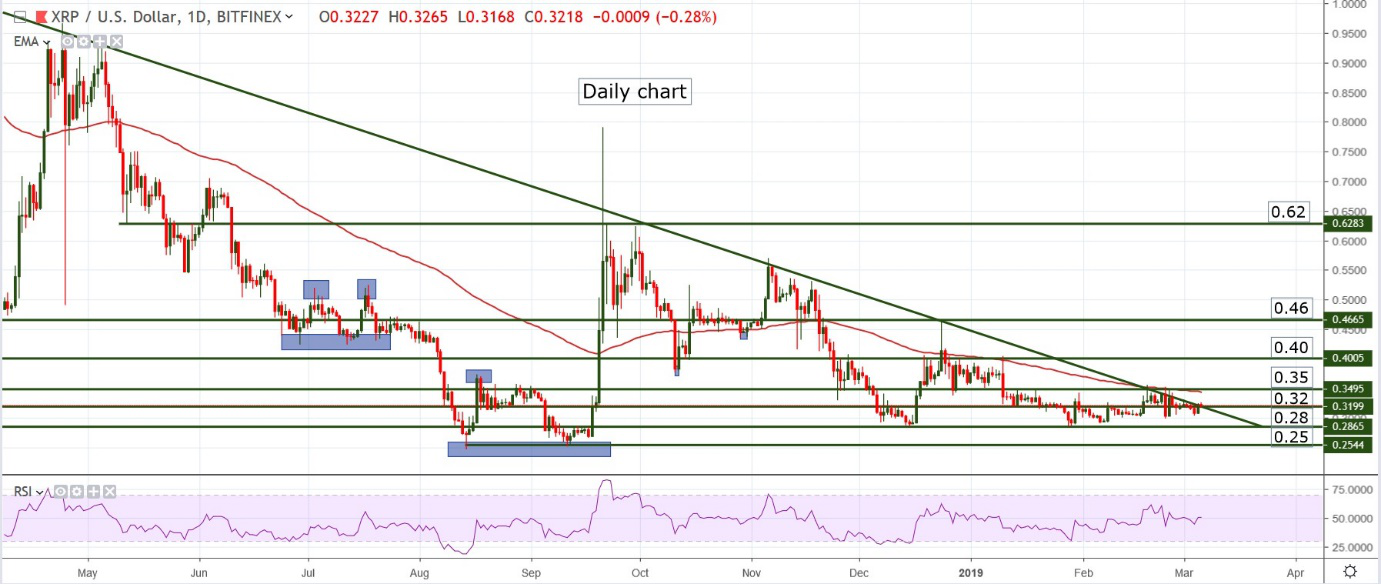
On a Daily chart we can see a lot more resistance levels overhead, but the most important for short-to-medium price action are $0.32, the bearish trend line, 100 days Exponential Moving Average and the level at $0.35. A break of this cluster of resistance will increase the chances of a long term move which will have $0.40 - $0.46 area as a target. That could be reached within a couple of months or even sooner if we get a major announcement or partnership with a new bank.
Daily Chart Support: $0.28, $0.25
Weekly Chart Support: $0.25
Daily Chart Resistance: $32 (currently tested), bearish trend line, 100 days EMA, $0.35, $0.40
Weekly Chart Resistance: $0.45, $0.80
Most likely scenario: bullish action, with a break of the trend line and all immediate resistance elements; over the next 2 to 6 months it’s likely to see extended bullish action,
Alternate scenario: continuation of the downtrend and break of $0.25; if this happens, expect a retracement shortly after the break.
 Arman Shirinyan
 Alex Dovbnya
 Dan Burgin
 Denys Serhiichuk