While other cryptocurrencies suffer under the bearish influence, Cardano ignores the trend and takes its own route. Today, we will observe a perfect geometry of ADA price chart that turns $0.1 from theorem to axiom. Check out Cardano price predictions from TradingView users.
Patterns Show the Way on the Map

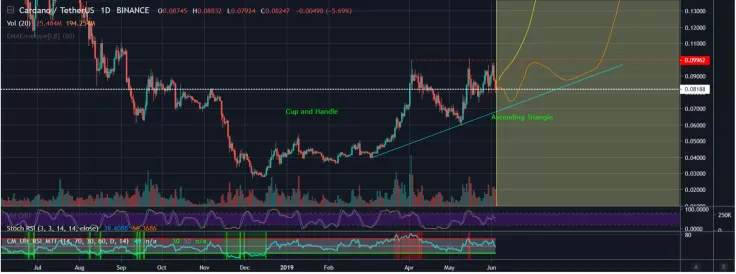
Looks like Cardano has formed the Cup and Handle pattern and is ending the handle with an ascending Triangle! Both are signs that an uptrend is coming. According to the trader, it will follow the yellow or orange lines on the chart. MaticMullet puts bids on the Orange line based off the RSI – it provides time to complete the ascending triangle. If it plays out, Cardano will reach the price of $0.1 during this summer.
Breakout opportunity is on the horizon

Cardano should be on your radar for some nice profits in the next coming weeks. Since the Shelley update is coming soon, ADA should go through a serious rally.
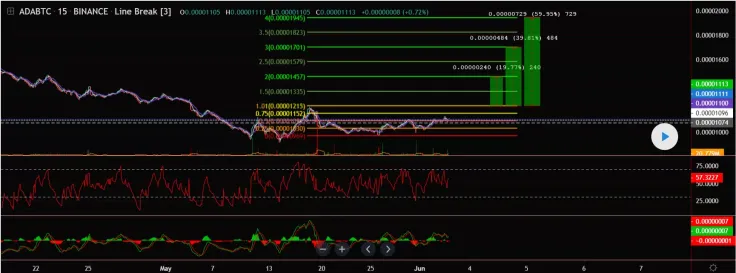
There’s a very interesting setup for ADA on the 15 min chart. Note that this trader doesn’t use ordinary candle sticks: he prefers 15-min line breaks for better precision. This strategy gives a better understanding of trends and allows for reaching better results.
So, how to play with ADA? As for the entry point, we have two options: a risky and a safer one.
Risky: Entry point at 1147 sats
Safer: Enter at 1216 sats (waiting for breakout confirmation)
What about the stop loss?
Risky option: 970 (Bigger risk of loss but a smaller chance it hit the stop loss before it goes up again and hit our target).
Safer option: 1068 (Smaller loss if it go south but bigger change it hit your stop loss and then go back and you know the story).
How to take profit along the uptrend?
TP1- 1476 (19.77 % gain). This is the safest take profit and the most likely to hit the target. Fib 2 level is equal to the amplitude of the latest retracement. Meaning the last retracement was 15% correction before his support and bounce back.
TP2- 1738 (39,88%) means you should be patient.
TP3_ 2001 (59,95%) is the riskiest option.
Short vs Long Perspectives

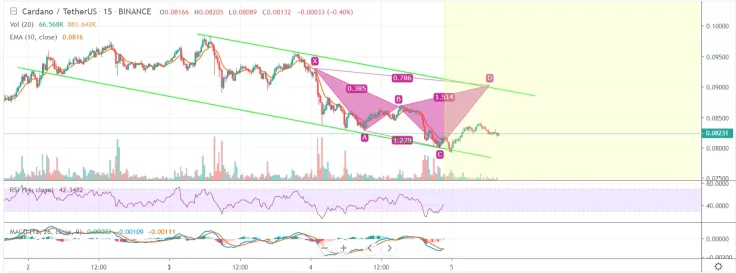
We have a Bearish Cypher pattern on the ADA/USDT on the 15 min TF, and 2 moves can be played here:
-
Long: The price seems to bounce on the support line while RSI enters the 30+ zone and the MACD seems to be ready for a bullish crossover of the signal.
-
Short: Following the Bearish Cypher, we can expect a dump of the price once D is reached which also corresponds to the resistance line.
Bottom Line
If you’re a confident trader, Cardano can bring you solid profits in the nearest future! it can play out if you short ADA after the right shoulder. But for now, we look to take a position and target 5-10% with a tight stop loss. ADA sell zone is right below the 200 MA.
If things go as predicted, Cardano can make a serious move and grow by up to 180%. So don’t miss your chance to make profits!
Cardano (ADA) price charts by TradingView
 Alex Dovbnya
 Denys Serhiichuk
 Gamza Khanzadaev