
Disclaimer: The opinions expressed by our writers are their own and do not represent the views of U.Today. The financial and market information provided on U.Today is intended for informational purposes only. U.Today is not liable for any financial losses incurred while trading cryptocurrencies. Conduct your own research by contacting financial experts before making any investment decisions. We believe that all content is accurate as of the date of publication, but certain offers mentioned may no longer be available.
Peter Brandt recently took to social media to share his insights into a Bitcoin price pattern that may signal impending movements of significance. Brandt's tweet posed a cryptic question, referencing a "coffin corner" and "springboard pattern," which are terms not commonly used in the technical analysis lexicon.
Upon closer inspection, Brandt's chart appears to show Bitcoin trading within a converging pattern, typically known as a symmetrical triangle in technical analysis. This pattern is often characterized by lower highs and higher lows as the price action narrows, indicating a balance between buyers and sellers. The convergence of these trend lines is where the potential for a significant price move emerges, as a breakout or breakdown could occur.
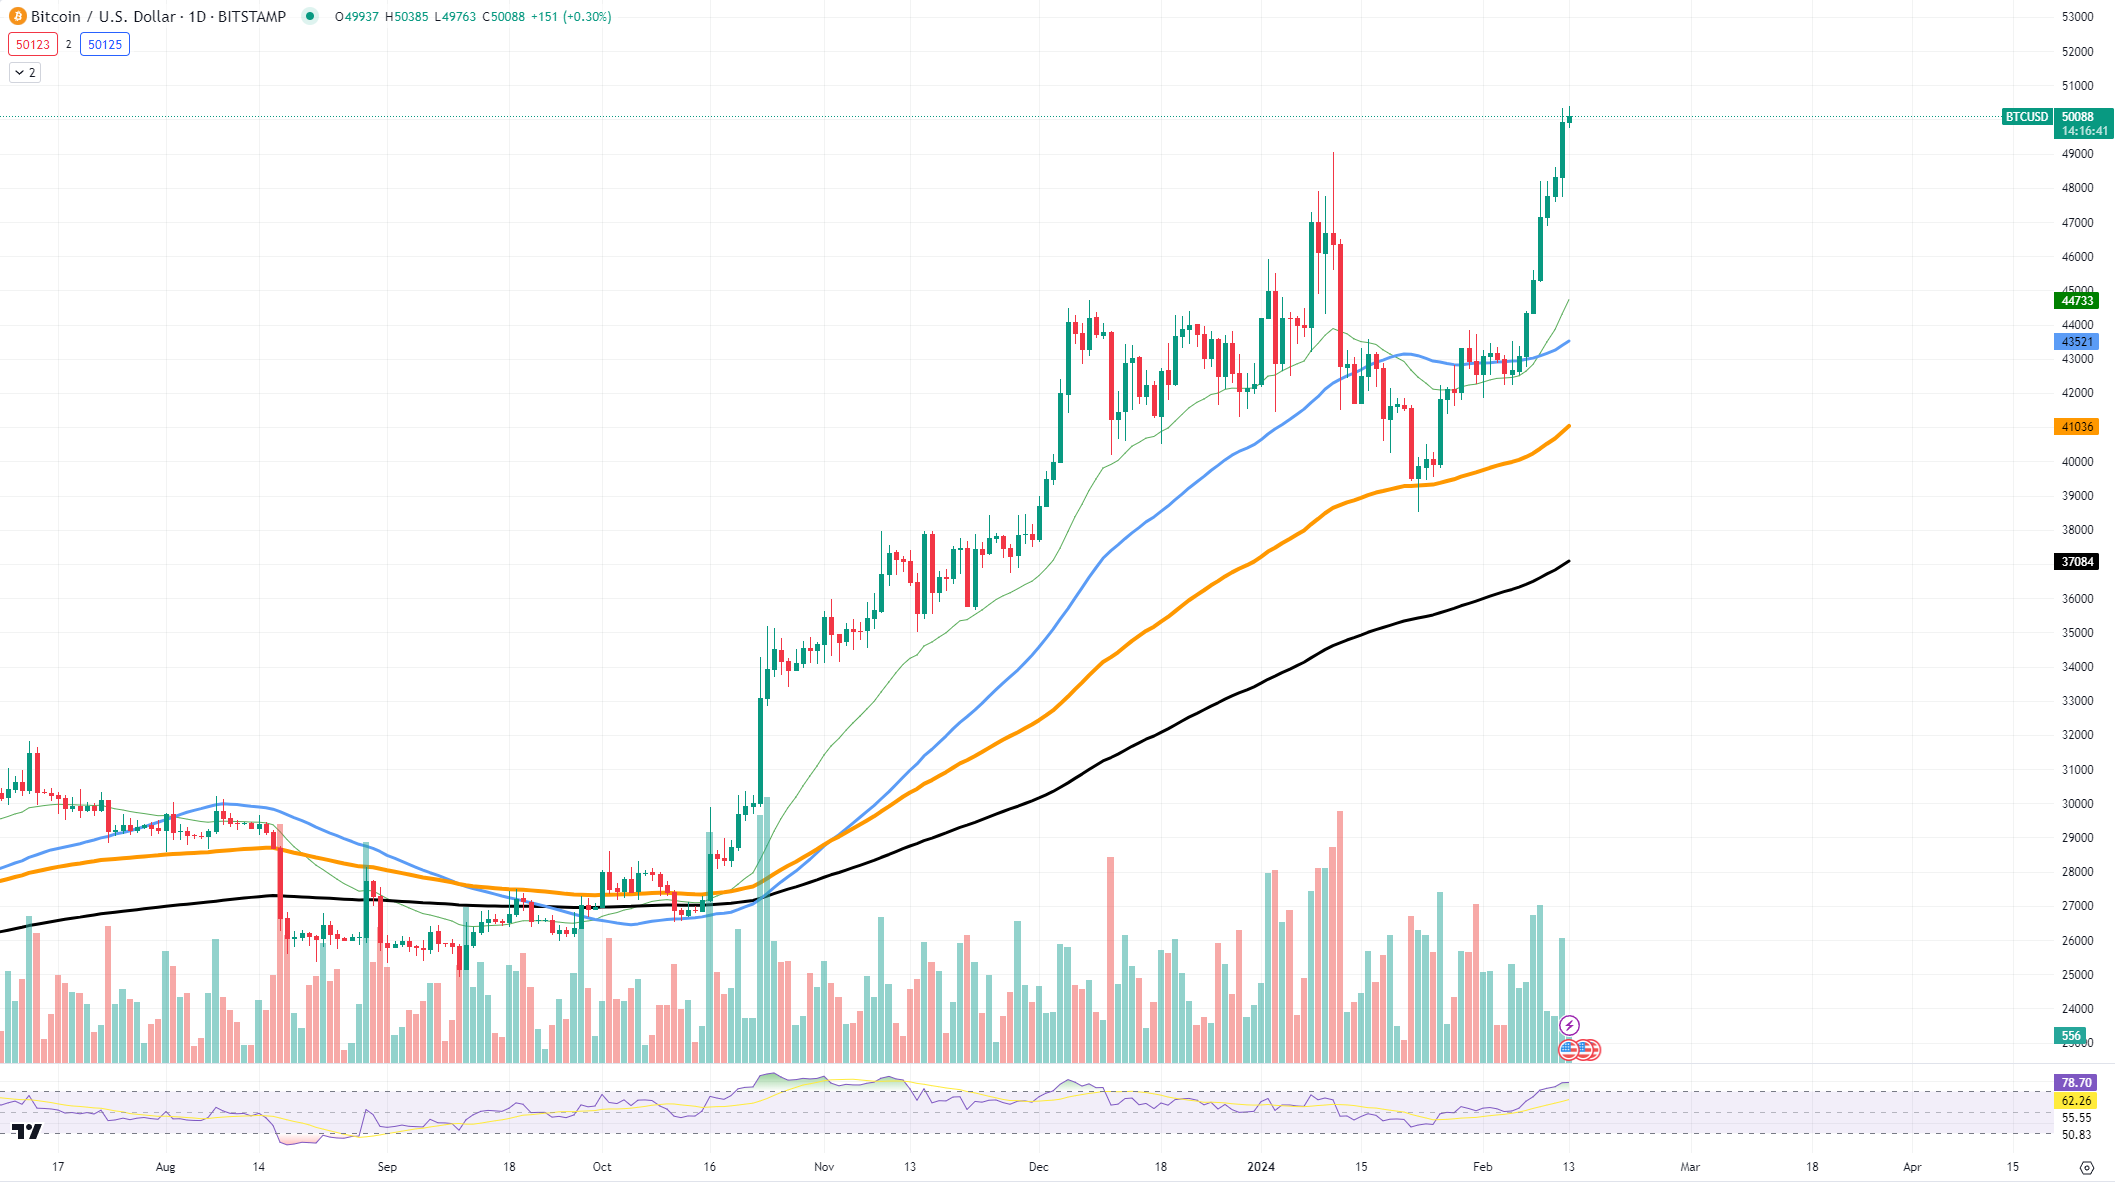
The implications of this pattern are twofold. A "coffin corner" could suggest a position where Bitcoin risks a sharp drop if support fails. Conversely, the "springboard pattern" implies a potential bullish breakout, where the price could leverage the narrowing consolidation to catapult upwards.
To correlate Brandt's observations with the broader market, one must consider the asset's support and resistance levels. Currently, Bitcoin shows a local support level around $37,084, which aligns with previous price consolidations and psychological round numbers that typically act as mental anchors for traders. On the resistance side, a local peak can be identified near $50,070, a level where past rallies have faced selling pressure.

In a growth scenario, if Bitcoin were to break above the resistance, it could validate the "springboard pattern," potentially leading to a test of higher resistance levels, with traders looking for historical price ceilings or Fibonacci extensions as possible targets.
Conversely, a price drop scenario might unfold if Bitcoin were to breach the support level, which could result in a "coffin corner" outcome. This could see the asset test lower supports, possibly seeking out previous significant lows or areas with high historical liquidity.
 Dan Burgin