
Disclaimer: The opinions expressed by our writers are their own and do not represent the views of U.Today. The financial and market information provided on U.Today is intended for informational purposes only. U.Today is not liable for any financial losses incurred while trading cryptocurrencies. Conduct your own research by contacting financial experts before making any investment decisions. We believe that all content is accurate as of the date of publication, but certain offers mentioned may no longer be available.
Solana is currently recovering a sizable portion of its lost value which suggests a possible reversal. On the chart a hidden head and shoulders pattern is developing though and it might be a significant indication of an approaching retracement. This bearish technical pattern could lead to a long-awaited correction in SOLs price for traders. Solana is currently trading at about $197 after experiencing a recovery.
The asset is demonstrating resilience above important moving averages, as shown by its daily gain of 1.60%. The short-term bullish sentiment has been strengthened by the recent recovery from the $190 support level. If momentum lessens, however, impending resistance levels at $209 and $212 may limit additional gains.
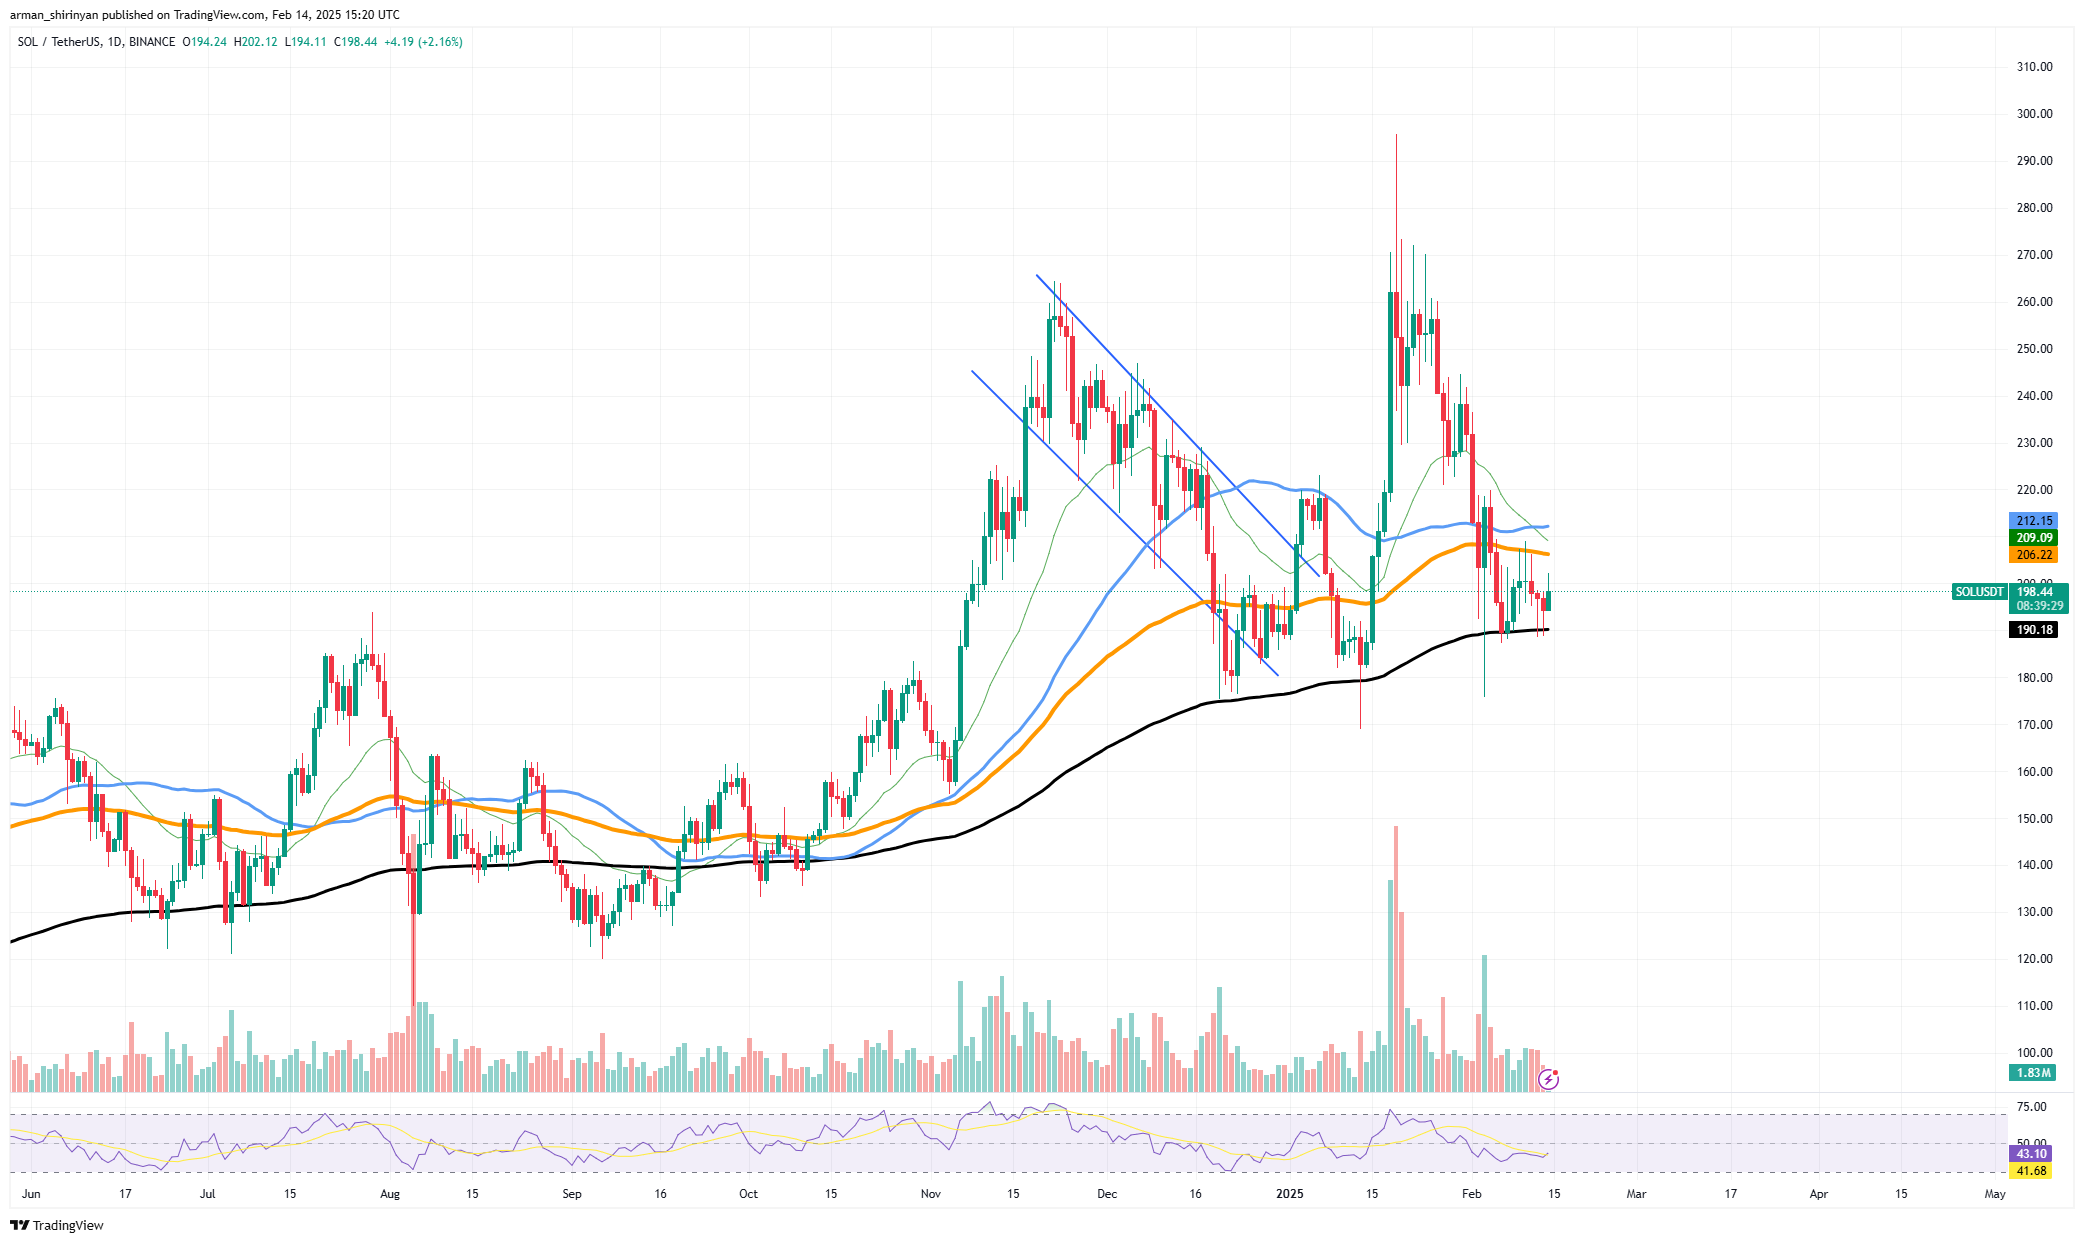
A classic technical pattern, the head and shoulders formation frequently marks the end of an uptrend and the start of a downturn. The pattern may be confirmed and a retracement may result if SOL is unable to overcome its resistance and complete the right shoulder. SOL may experience a decline back toward the $190–$180 support range starting a more extensive correction phase if the H&S pattern is confirmed.
The asset may move towards $220 and reclaim lost highs if SOL is able to invalidate the pattern by breaking above $212.
XRP aims at reversal
With a daily gain of 6.74% and a current price of $2.73, XPR is clearly ready for another short-term rally. XRP is still maintaining momentum above 200-day moving average and showing an impressive recovery from the $2.2 support level.
XRP is displaying clear indications of a bullish reversal. XRP might be preparing for another rally based on the recent increase in buying pressure assuming it can overcome significant technical resistance levels. XRP has successfully maintained momentum above the 200-day moving average after making an impressive recovery from the $2. 20 support level.
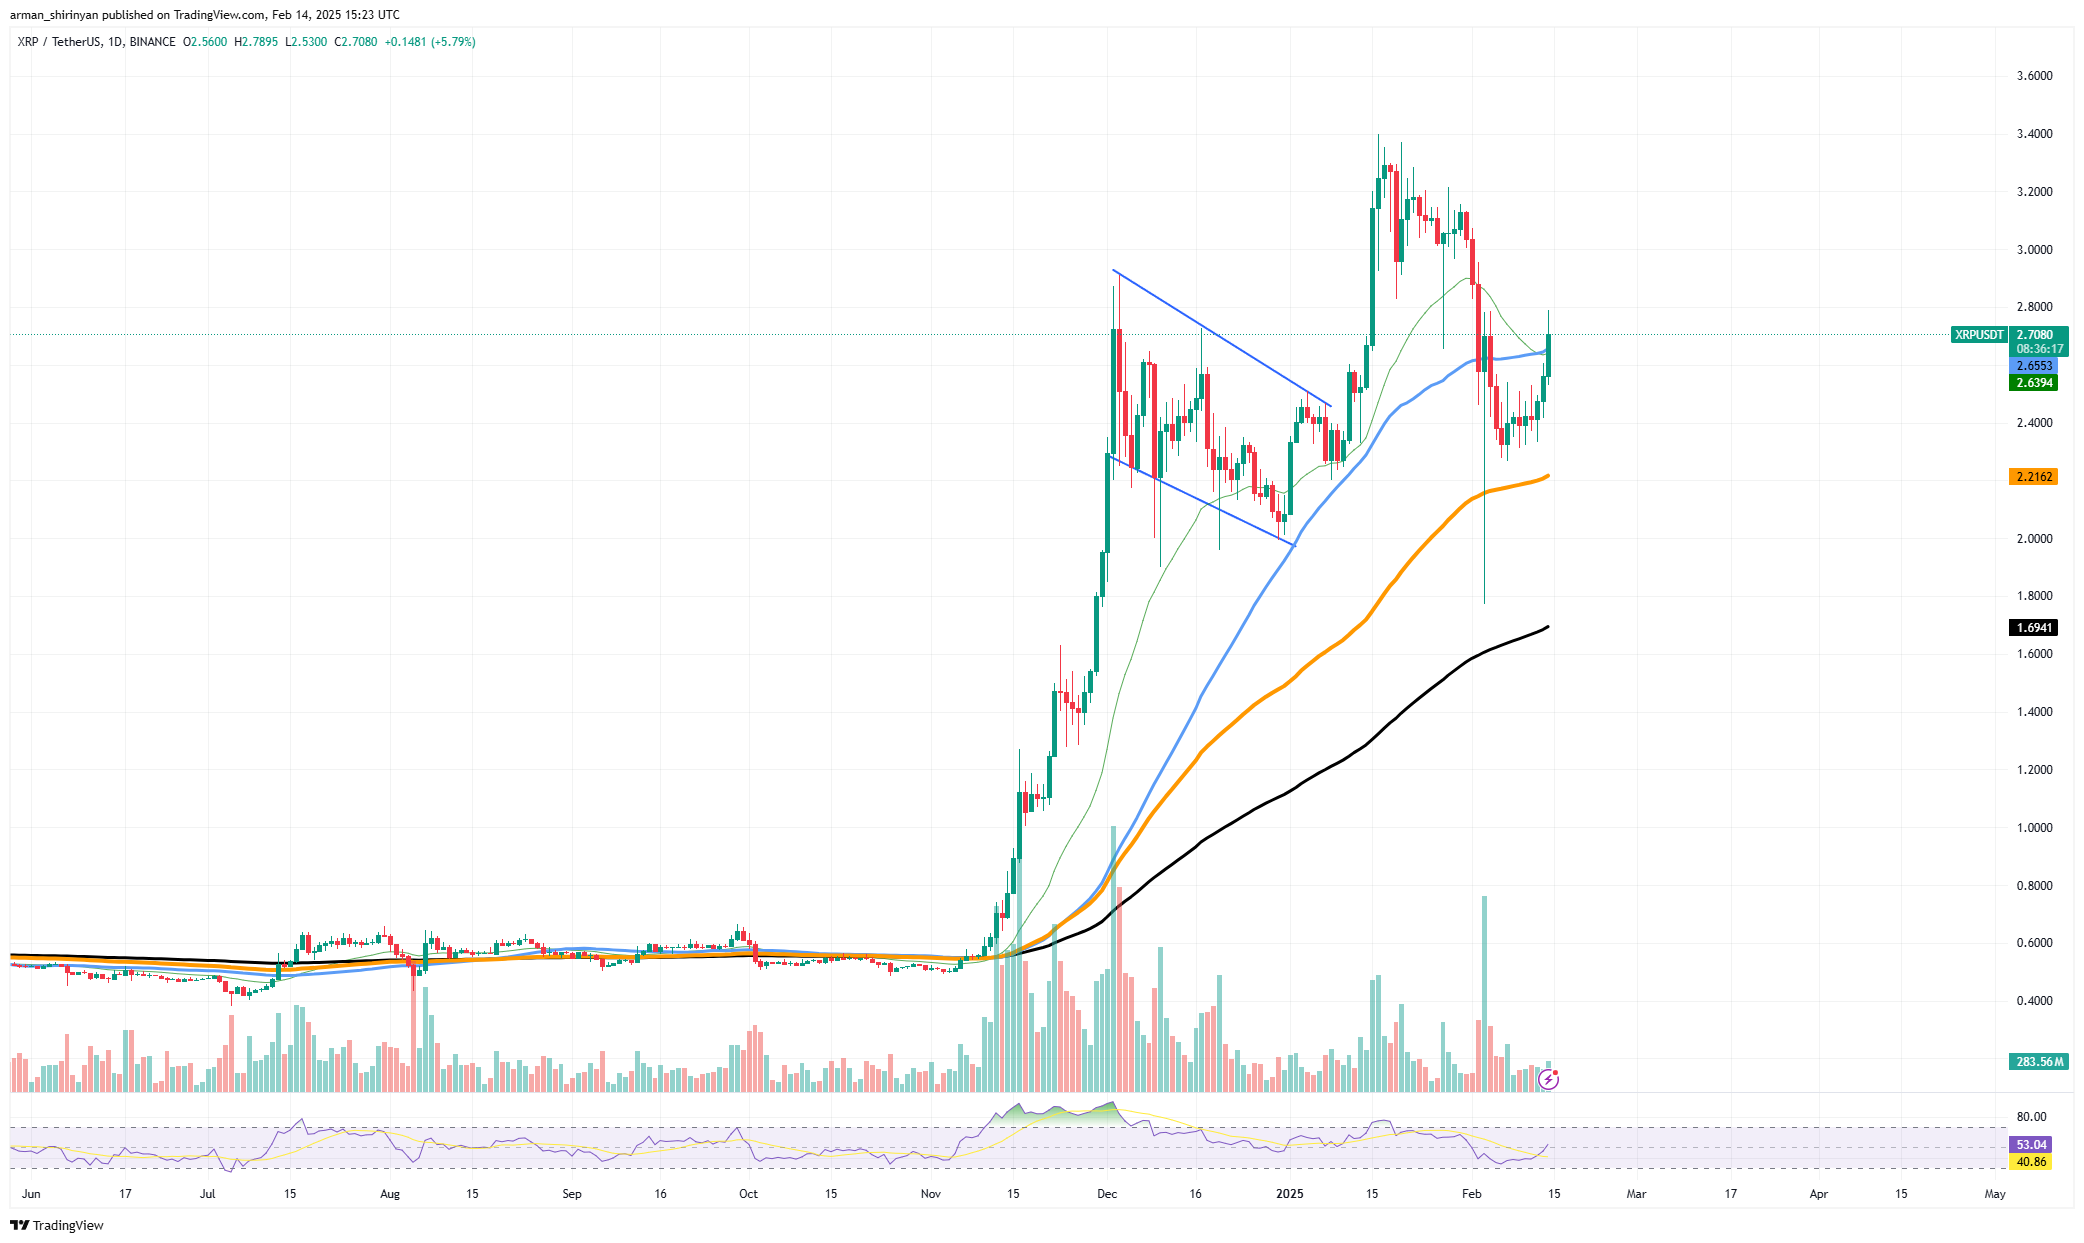
The 50-day Exponential Moving Average (EMA) which is presently trading close to $2. 85 will be the next significant test. A clear breakout above this level would probably indicate that the uptrend is still going strong which could push XRP closer to $3. 00 and higher. With XRP making higher lows and seeing an increase in trading volume the technical setup supports a bullish breakout. The possibility of further upward momentum is further supported by the RSIs recovery from oversold levels.
The successful closing of XRP above the 50 EMA may lead to a large rally and draw additional traders to the asset. Before making a clear move XRP may range between $2. 40 and $2. 85 in a subsequent consolidation phase if this resistance is not broken.
Ethereum volatility might explode
Ethereum price shift might happen sooner than the majority might expect thanks to the rapid conversion of moving averages that quite often bring activity back to the market, making things way more interesting.
ETH is currently trading at about $2,699 up 0.86% for the day after a protracted period of decline. With important moving averages starting to converge the market might be getting ready for a breakout that would raise ETH above the crucial resistance level of $3,000.

Following a recent low of about $2,500 ETH has been making an effort to bounce back. Although it has recovered, the asset is still below its 200-day and 50-day exponential moving averages (EMAs) which are currently at $3,124 and $3,085 respectively. The beginning of a more extensive rally may be indicated if Ethereum is able to break above these EMA's.
A breakout above $3,000 might be on the horizon given Ethereum's recent price action and rising trading volume. With rising volatility suggesting the potential for a significant price move Ethereum is currently at a turning point. ETH may see a rally above $3,000 if it can recover important resistance levels.
 Dan Burgin
 U.Today Editorial Team