
Disclaimer: The opinions expressed by our writers are their own and do not represent the views of U.Today. The financial and market information provided on U.Today is intended for informational purposes only. U.Today is not liable for any financial losses incurred while trading cryptocurrencies. Conduct your own research by contacting financial experts before making any investment decisions. We believe that all content is accurate as of the date of publication, but certain offers mentioned may no longer be available.
After the sudden 10% spike of Ethereum's price on the cryptocurrency market, Santiment has provided an interesting on-chain and market metric that suggests that the asset is moving in the "opportunity zone," and here's what it means.
The MVRV indicator
The opportunity and sell zones are being determined by the MVRV indicator, which is the ratio of the total market value of an asset and its realized value. With the help of the indicator, traders are able to determine whether an asset is overbought or oversold.
? #Ethereum's price has skyrocketed +9.2% in just 3 hours, and '#bloodinthestreets' metrics such as 30-day MVRV was showing major trader pain and #FUD from $ETH #hodlers. When this metric falls below -10 to -15%, prices generally begin turning positive. https://t.co/p51IybOgdI pic.twitter.com/WTUZ2nZREv
— Santiment (@santimentfeed) December 15, 2021
While every deal on the cryptocurrency market is tied to some risks, indicators like MVRV show the current degree of the actual trend. Whenever large Ethereum holders sell their assets more aggressively than usual, the MVRV ratio tends to decrease faster and determine if there is a place for recovery or not.
Is Ethereum in the opportunity zone now?
According to the MVRV indicator that is now moving at approximately -10%, Ethereum is being highly oversold by large holders and is actually moving in the "opportunity zone" which, according to the market's history, was an accurate indication of the local bottom.

While the ratio could give traders a hint toward a short-term reversal of the trend, the indicator is not designed to give out any signals about the long-term condition of the market. Prior to the 10% spike, the indicator has reached a four-month bottom. The last time the MVRV ratio was close to -10% was at the beginning of December.
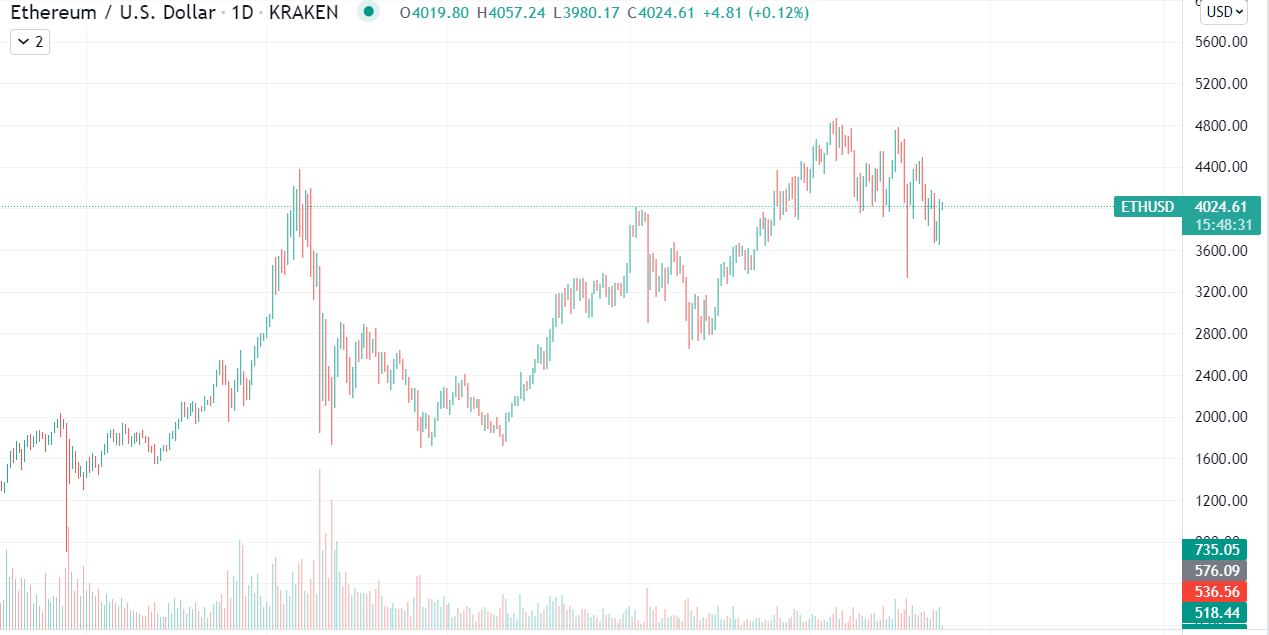
At press time, Ethereum is trading at $4,025, without having any troubles breaking through the expected $4,000 resistance. According to the chart's data, Ether is moving in a short-term local downtrend since Dec. 1.
 Dan Burgin