Disclaimer: The opinions expressed by our writers are their own and do not represent the views of U.Today. The financial and market information provided on U.Today is intended for informational purposes only. U.Today is not liable for any financial losses incurred while trading cryptocurrencies. Conduct your own research by contacting financial experts before making any investment decisions. We believe that all content is accurate as of the date of publication, but certain offers mentioned may no longer be available.
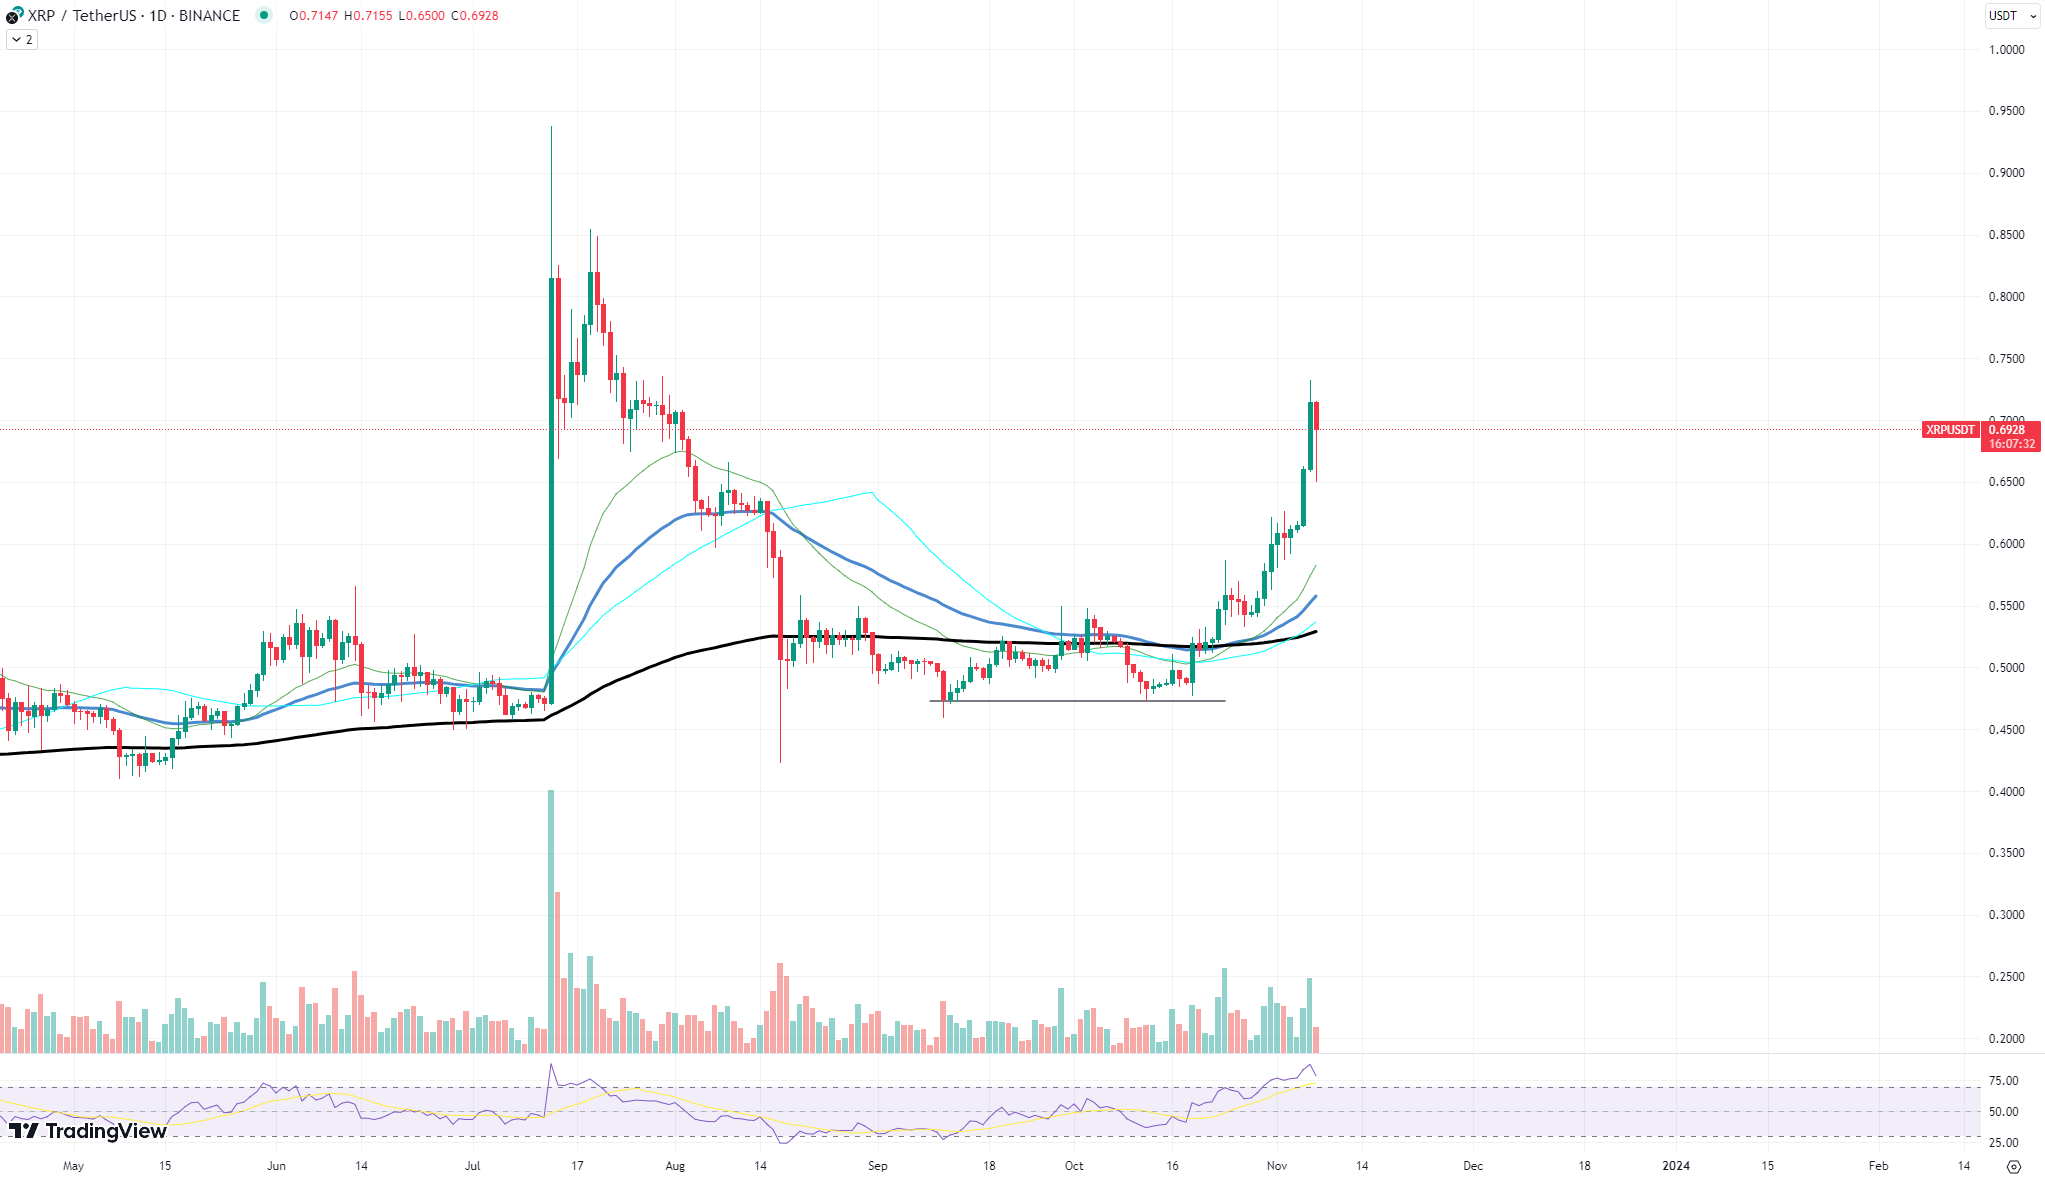
As the digital asset market navigates through a correction, XRP has recently faced a significant hurdle at the $0.7 mark. This price point represents a substantial resistance level, and the latest price movements have left many investors questioning if XRP has the momentum to sustain a breakthrough.
The current chart illustrates a stark reversal in XRP's trajectory, suggesting that the $0.7 ceiling proved too robust for the current buying pressure. After an enthusiastic rally, XRP's value approached this threshold but was met with a vigorous sell-off, evident by the long upper shadow of the latest candlestick. Such price action typically signifies a strong rejection and can often precede a potential downturn.

A deeper look into the technical indicators provides further insight into the asset's conditions. The Relative Strength Index (RSI), a momentum oscillator that measures the speed and change of price movements, is indicating a massively overbought market for XRP. When the RSI exceeds 70, it is generally understood that the asset may be overextended and could be due for a correction — a reading that is currently reflected on the chart.
Additionally, the moving averages — often used to identify the direction of the trend and potential support and resistance levels — show that despite the recent rally, the swift reversal places XRP's price near the shorter-term moving averages. This proximity suggests a loss of upward momentum and may act as a short-term support if the price continues to decline.
The substantial volume spike accompanying the reversal highlights the intensity of the sell-off, emphasizing the gravity of the resistance encountered at $0.7. Such volume often accompanies decisive movements in price, signaling a strong sentiment shift among traders and investors.

 Vladislav Sopov
 Dan Burgin