Dash was originally launched in early 2014 as a fork of Bitcoin, under the name of Xcoin, and renamed Darkcoin soon after. In its early days, it was allegedly used in darknet markets, mainly due to its focus on privacy, but it has since seen the light. The coin is now on the rise in terms of popularity and one we need to keep an eye on.
In March 2015 the altcoin was renamed Dash and as of August 2016, it is no longer used in any notable darknet market (that we can tell, it's the darknet after all). Dash’s prime goal is to allow instant, private payments online or in-store using their secure open-source platform. To achieve this, its developers instituted a system of Masternodes (proof of stake mining that you can invest in) to simplify and expedite the validation process of transactions.
Dash introduced a self-funding model, which allows for continued development without being dependent on outside influx of capital: the block rewards are split between Masternodes (45% share), Miners AKA lightweight nodes (45%) and Treasury (10%); the latter is used to fund projects and future developments of the network.
DASH/USD Technical Outlook - The big picture
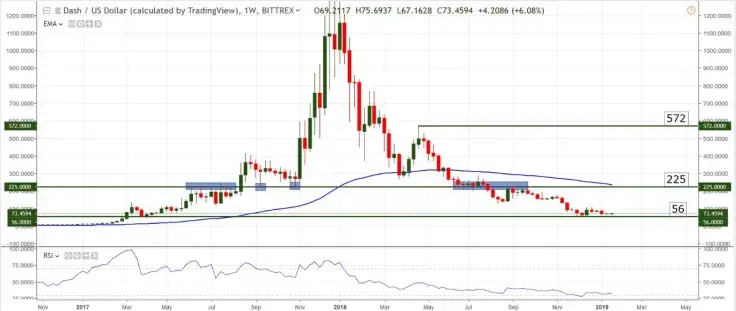
Having reached a high of almost 1,500 against the US Dollar in late December 2017, DASH is currently trading at a mere $72 and has been in a clear downtrend for the entirety of 2018. Its weekly chart looks like the textbook entry for a bearish trend, with lower lows and lower highs printed with each new wave.

Currently the pair is testing the support at 55 – 56, which is a level last touched in early 2017, just before the bull run started. If this support is shattered, we can expect to see extremely low prices, like 2016 levels (15 – 20 USD per 1 DASH). It must be noted, however, that the downtrend is starting to fade: the candles are smaller, the dips are not as strong, and momentum is fading.
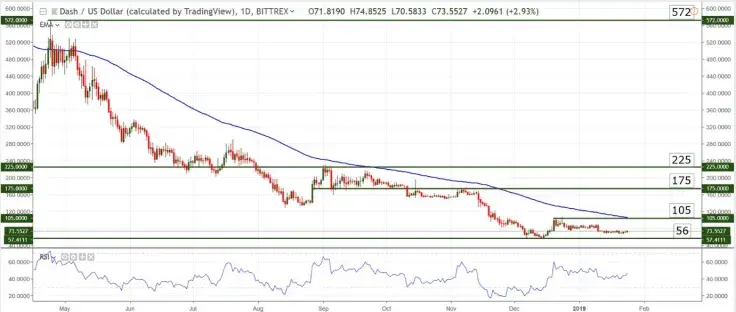
The Daily chart tells the same story as the Weekly, depicting a textbook downtrend but one that is starting to slow down. We have two additional resistance levels on this chart (105 and 175) and both of them will probably hinder any prolonged upside movement if that should develop.

In my view, the only chance of bullish movement will come from the exhaustion of the downtrend because so far nothing points towards a trend reversal; sooner or later price is just going to get so low people can't help but buy it.
As long as the pair is trading below 105, the outlook is bearish, with the possibility of small bumps in price in the form of retracements. A move above 100 – 105 and the Exponential Moving Average will probably make way for additional buying but even if that happens, as long as we don’t see a significantly higher high and higher low, we cannot talk about any type of long-term trend reversal.
Daily Chart Support: 55 - 60
Weekly Chart Support: 55 - 60
Daily Chart Resistance: 100 days EMA, horizontal levels: 100, 175, 200, 225
Weekly Chart Resistance: 100 weeks EMA, horizontal levels at 225 and 572
Most likely scenario: continuation of the downtrend, possible low volatility and/or minor upswings due to downtrend exhaustion
Alternate scenario: break above 105, move into 175 during the weeks/months to come
 Godfrey Benjamin
 Yuri Molchan
 Arman Shirinyan
 Gamza Khanzadaev
 Tomiwabold Olajide