
Disclaimer: The opinions expressed by our writers are their own and do not represent the views of U.Today. The financial and market information provided on U.Today is intended for informational purposes only. U.Today is not liable for any financial losses incurred while trading cryptocurrencies. Conduct your own research by contacting financial experts before making any investment decisions. We believe that all content is accurate as of the date of publication, but certain offers mentioned may no longer be available.
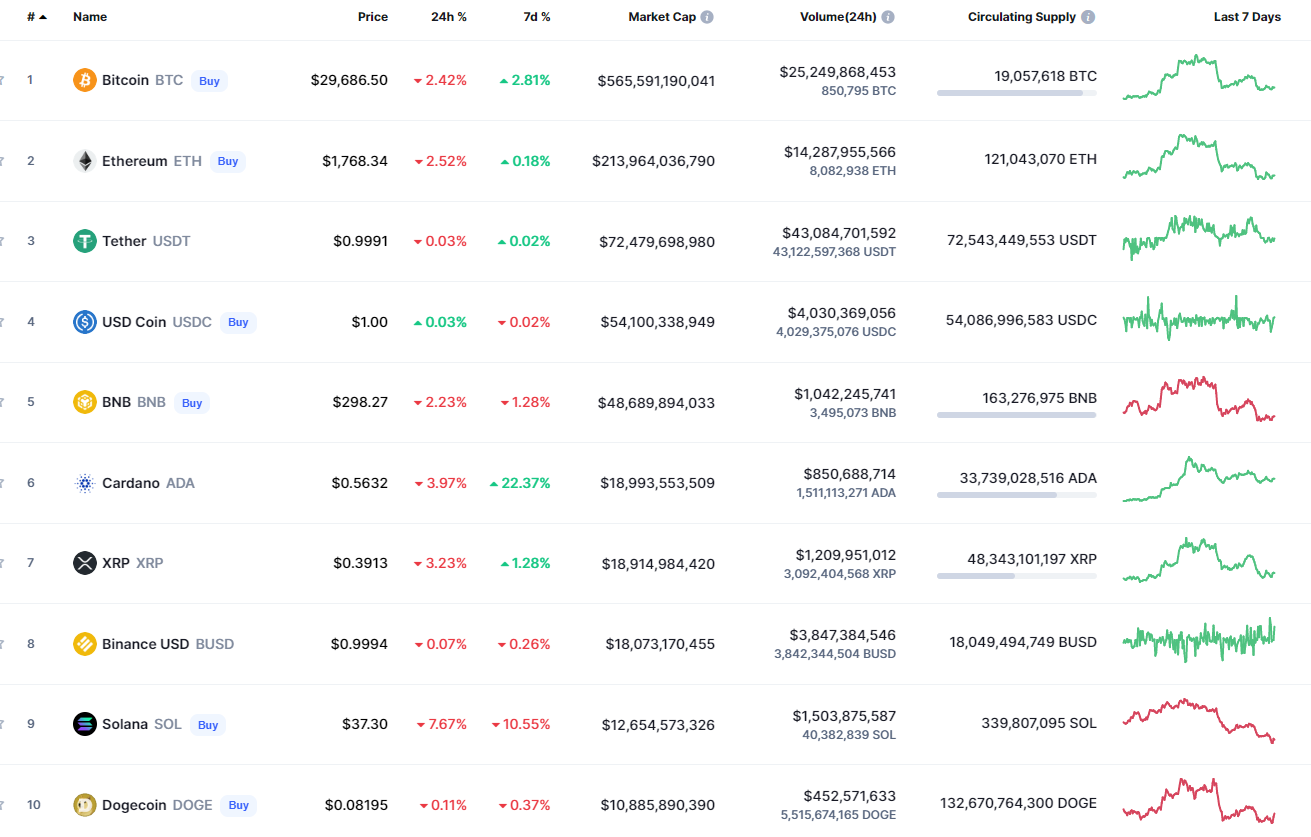
The weekend has started with the continued downward movement of the cryptocurrency market.
BTC/USD
Bitcoin (BTC) is going down by 2.68% over the last 24 hours.
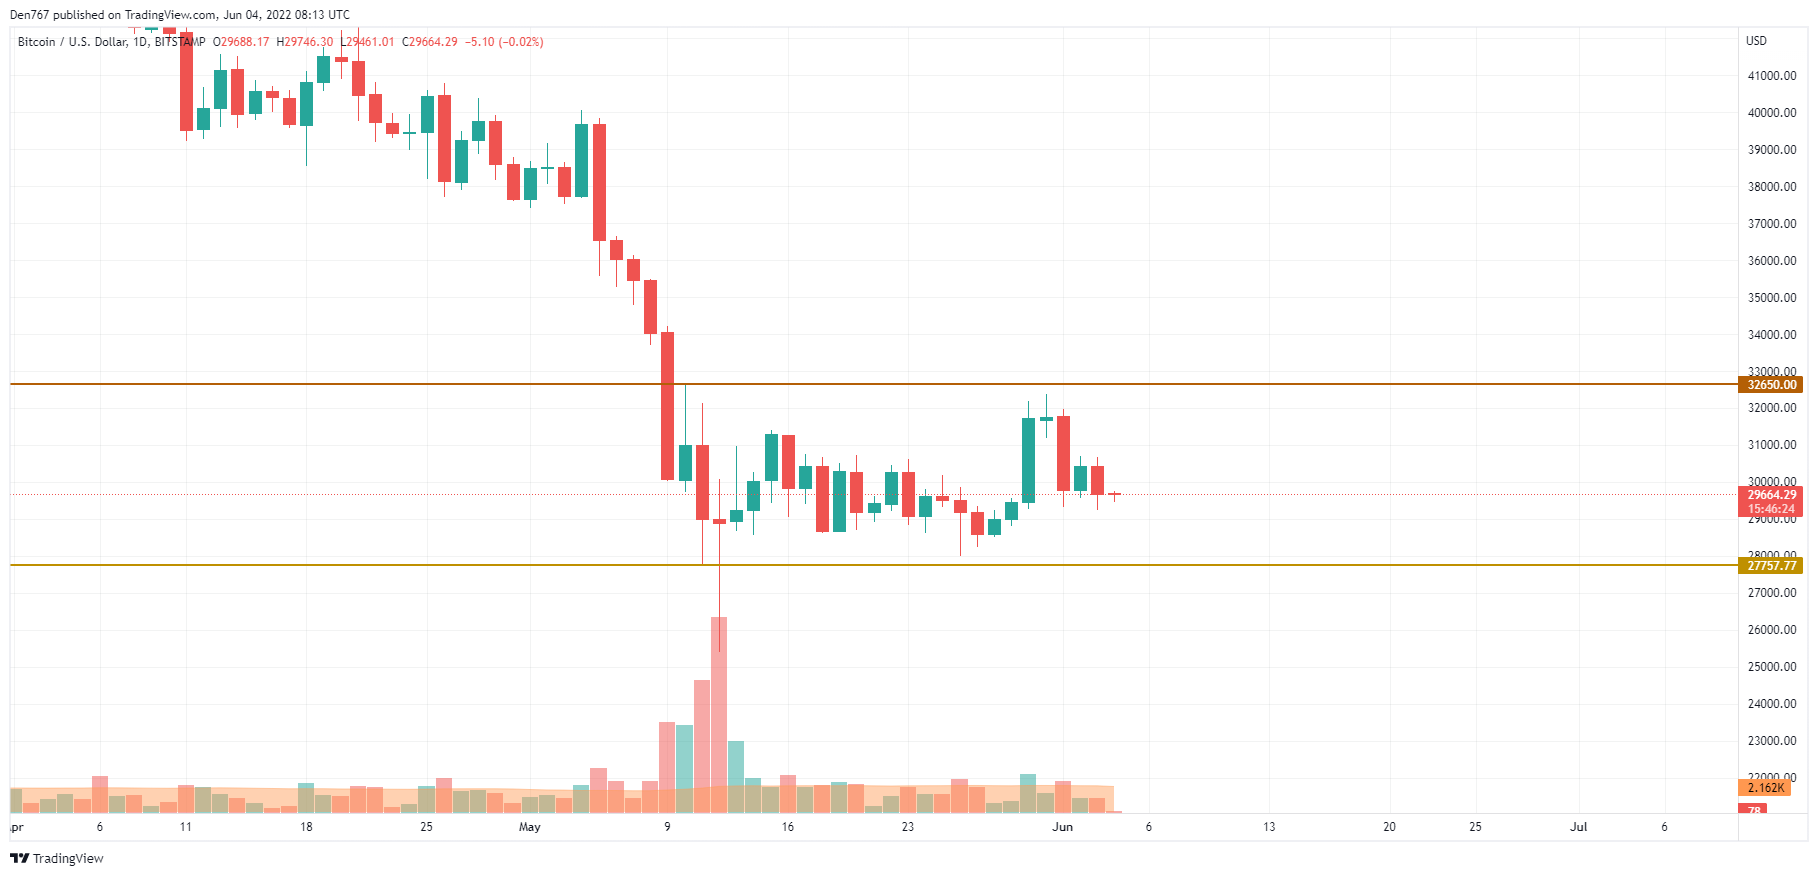
Despite the fall, the rate could bounce back to the $29,000 mark, which means that sideways trading remains the more likely scenario for the upcoming days. In addition, the declining trading volume confirms this fact.
In this regard, one should not expect any sharp moves from the main crypto in the near future as the coin has not accumulated enough power for that.
Bitcoin is trading at $29,700 at press time.
ETH/USD
Ethereum (ETH) keeps looking weaker than Bitcoin (BTC) with a drop of 2.79%.
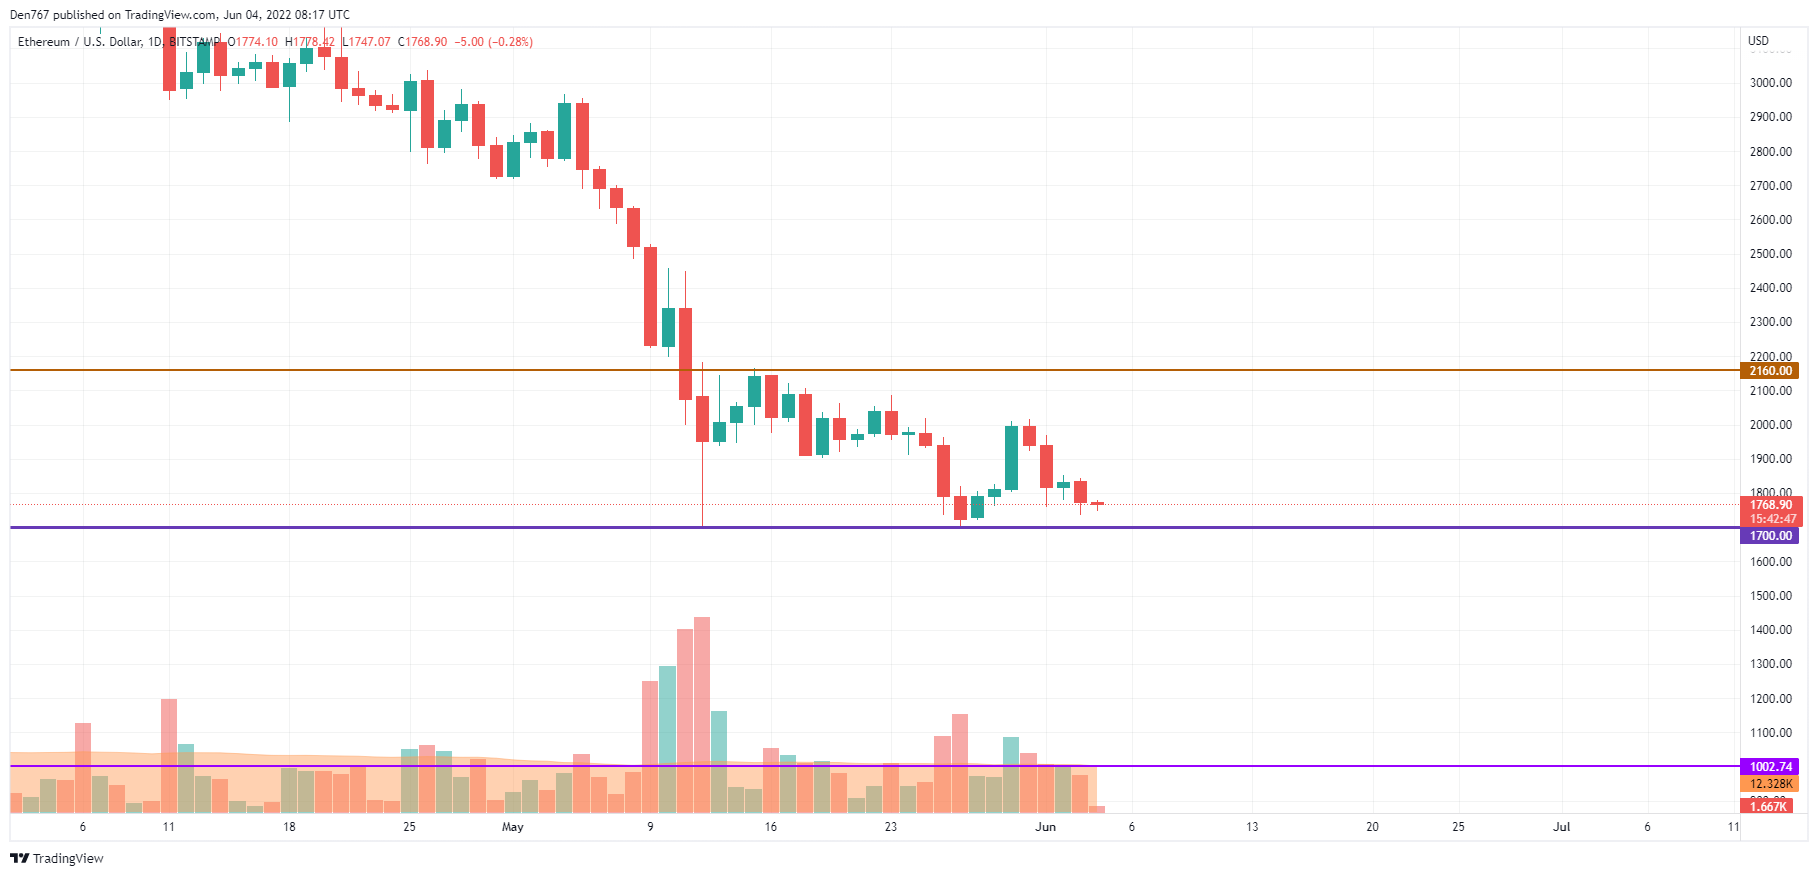
Ethereum (ETH) is located near the support level at $1,700, which means that a further decline is more anticipated than further growth. The high selling volume confirms this exectation. If buyers cannot return the rate to the $1,800 zone by the end of the week, there are chances to see a sharp drop below $1,700 by the end of the month.
Ethereum is trading at $1,768 at press time.
SOL/USD
Solana (SOL) is the biggest loser from the list today, going down by 7.54%.
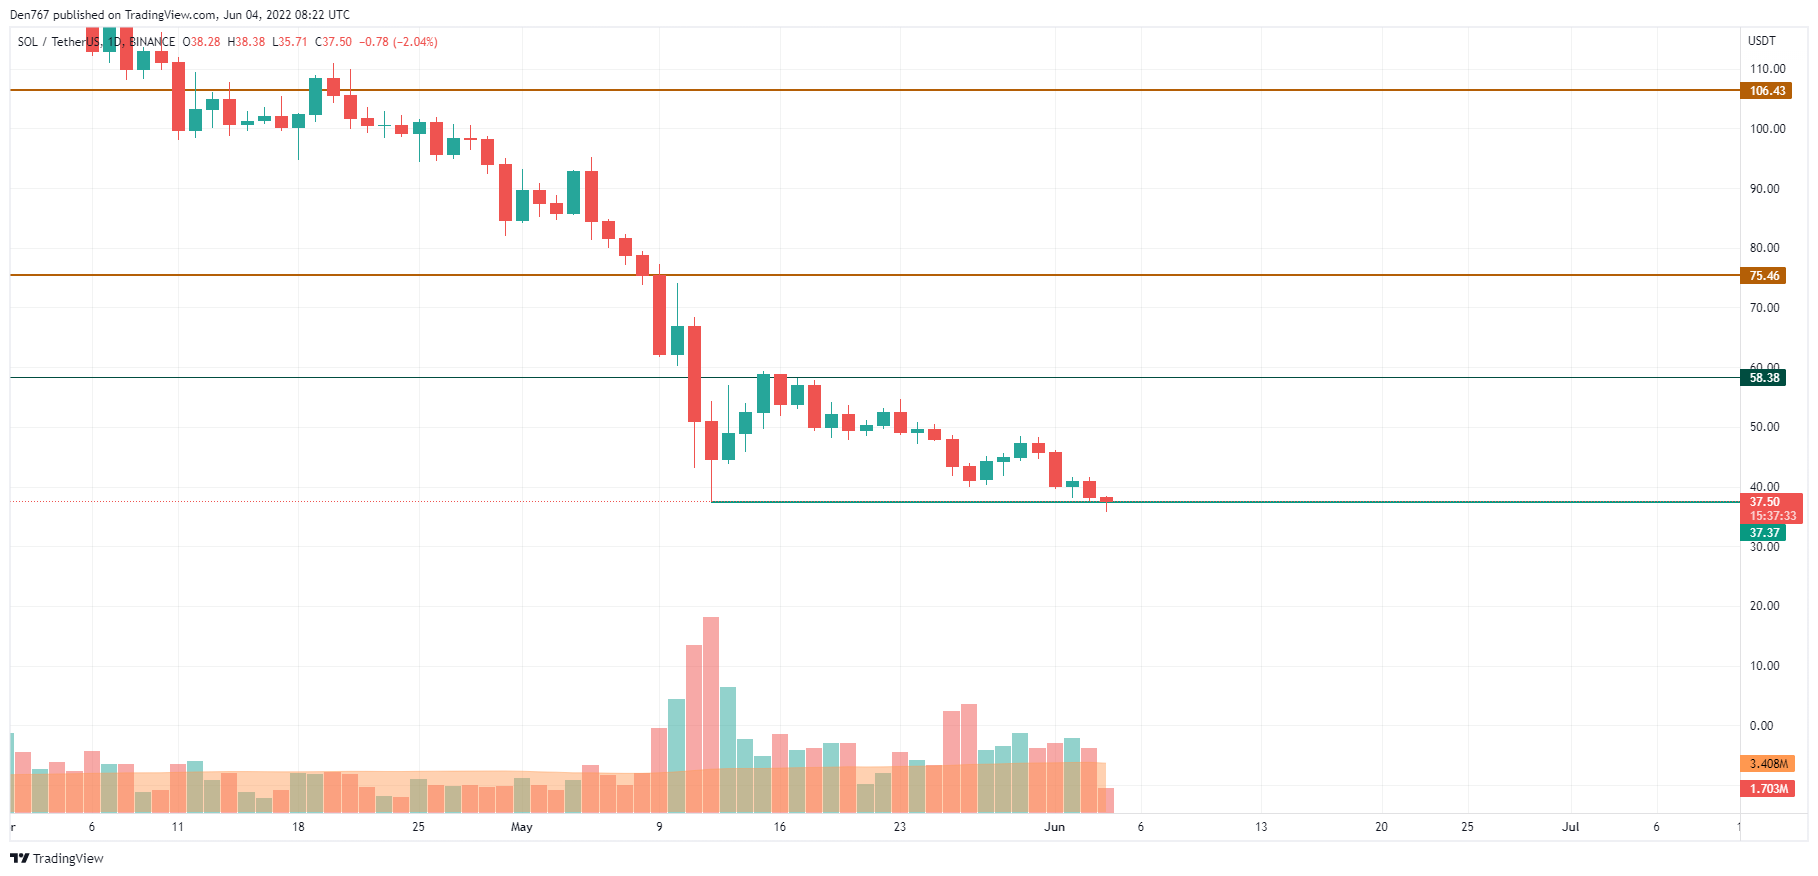
Solana (SOL) has made a false breakout of the $37.37 level on the daily chart. If buyers can hold the rate above this mark until the end of the day, the bounceback might continue to the $40 mark next week.
SOL is trading at $37.54 at press time.
 Dan Burgin
 U.Today Editorial Team